
Figures & data
Figure 1. Data-gathering process.
Figure 2. Data analysis steps.
Figure 3. Conceptual framework.
Figure 4. (a) Cumulative frequency of published documents from WOS vs Scopus databases until 2020. (b) Cumulative frequency of published documents from the merged sample (WOS and Scopus databases) until 2020.
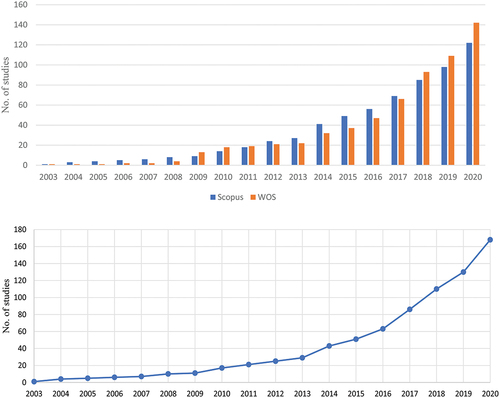
Figure 5. Top 10 publishing journals from the WOS data set.
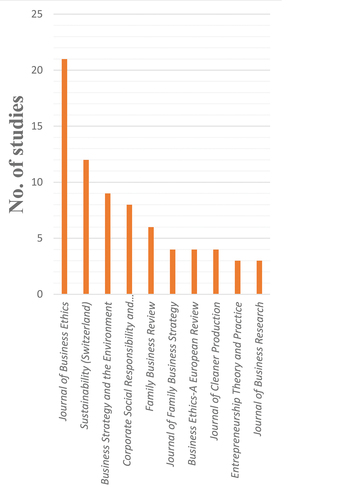
Figure 6. Top 10 publishing journals from the Scopus data set.
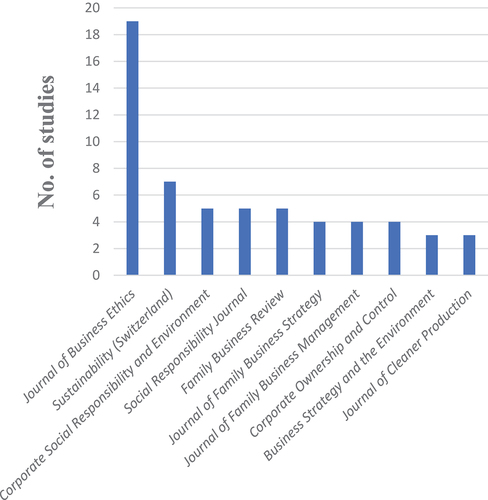
Figure 7. Top 10 publishing journals from the merged (Scopus + WOS) data set.
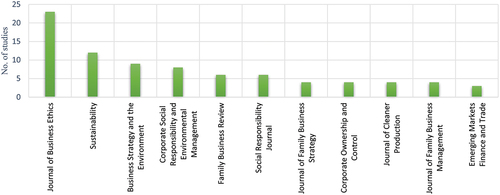
Table 1. Top 20 most cited studies in WOS and Scopus.
Figure 8. Bibliographic coupling network visualization of WOS articles stemming from the analysis.
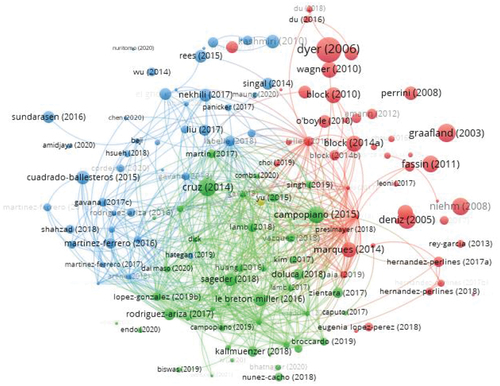
Figure 9. Bibliographic coupling network visualization of Scopus articles stemming from the analysis.
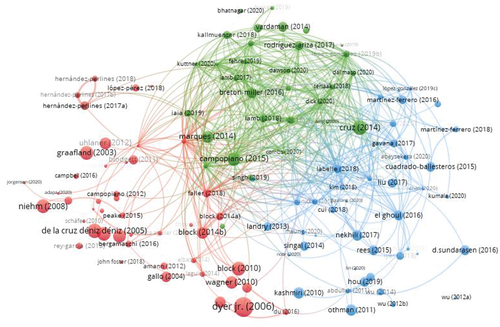
Figure 10. Drivers of CSR in FFs.
Figure 11. Outcomes of CSR adoption in FFs.
Figure 12. SLR outcomes based on adopted framework.
Table 2. Matrix analysis of the drivers of CSR adoption in FFs.
Table 3. Matrix analysis of the outcomes of CSR adoption in FFs.
Figure 13. The empirical setting of reviewed studies.
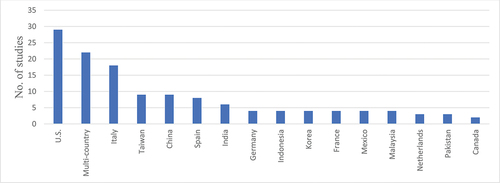
Table 4. Selected opportunities for future research on CSR in FFs based on the SLR.