Figures & data
Table 1. Estimated annual birth and mortality rates, rate of increase, carrying capacity and other parameters, derived from the literature for brushtail possums (Trichosurus vulpecula), feral ferrets (Mustela furo), feral pigs (Sus scrofa) and red deer (Cervus elaphus) in forest and grassland habitats, used in multi-host models to predict long-term persistence of tuberculosis.
Table 2. Main intra- and inter-specific transmission routes and estimated transmission rates (β in km2 per individual per annum) of Mycobacterium bovis, derived from the literature, for brushtail possums (Trichosurus vulpecula), ferrets (Mustela furo), pigs (Sus scrofa) and red deer (Cervus elaphus), used in multi-host models to predict long-term persistence of tuberculosis.
Table 3. Estimated disease mortality and pseudo-vertical transmission rates (per annum), derived from the literature, for brushtail possums (Trichosurus vulpecula), ferrets (Mustela furo), pigs (Sus scrofa) and red deer (Cervus elaphus), used in multi-host models to predict long-term persistence of tuberculosis.
Figure 1. Predicted animal population density (blue lines) and proportional prevalence of tuberculosis (TB; red lines) from a three-host model in a forest habitat, with simulated possum control imposed at 21, 26 and 31 years for a) possum, b) deer, and c) pig populations. Solid lines are the median values and dotted lines are the 2.5 and 97.5 percentiles of model simulations. Arrows indicate the timing of possum-control operations.
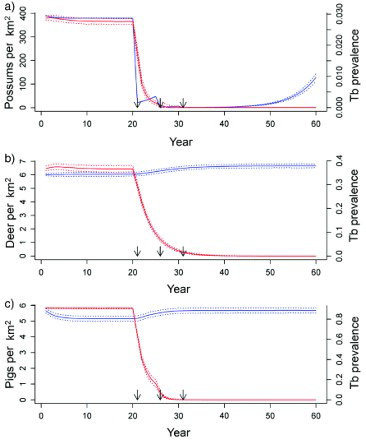
Figure 2. Predicted proportional prevalence of tuberculosis (TB) in possums from possum-only (dashed line) and three-host (solid line) model simulations in a forest habitat, with simulated possum control imposed at 21, 26 and 31 years. Arrows indicate the timing of possum control operations.
Figure 3. Proportional contribution to variance (sensitivity; Si) in the predicted persistence of tuberculosis (TB) for three-host simulation models, for a) forest and b) grassland habitats, contributed by variation in disease parameter values. TB persistence is the proportion of simulated populations of possums (P; black bars), deer (D), ferret (F) (both dark grey bars), or pigs (H; light grey bars) with infected individuals still present 20 years after three consecutive possum control operations. β is the disease transmission rate, α is the disease mortality rate and p is the pseudo-vertical transmission rate.
Figure 4. Predicted animal population density (blue lines) and proportional prevalence of tuberculosis (TB; red lines) from a three-host model in a grasslands habitat, with simulated possum control imposed at 21, 26 and 31 years for a) possum, b) ferret, and c) pig populations. Solid lines are the median values and dotted lines are the 2.5 and 97.5 percentiles of model simulations. Arrows indicate the timing of possum control operations.
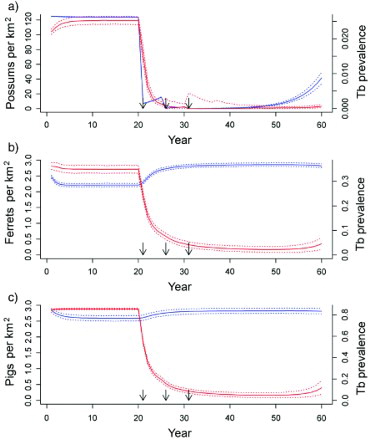
Figure 5. Predicted proportional prevalence of tuberculosis (TB) in possums from possum-only (dashed line) and three-host (solid line) model simulations in a grassland habitat, with simulated possum control imposed at 21, 26 and 31 years. Arrows indicate the timing of possum control operations.