Figures & data
Table 1. Number of cases of tuberculosis identified in cattle and pigs at export meat works and abattoirs in New Zealand during a 12-month period in 1904–1905 (from Anonymous Citation1905).
Table 2. Number of dairy cattle tested and percentage that tested positive (reactor) for tuberculosis (TB) between 1962 to 31 March 1968 in the Buller district of the West Coast region and the rest of New Zealand (from Anonymous Citation1968; J. Edington2, pers. comm.).
Figure 1. Percentage of total cattle tested for tuberculosis (TB) that were test-positive and sent for slaughter (red bars) and percentage of herds (n=24) that were infected with TB (blue triangles) in the Buller South area (mean combined cattle population 4,474) of the West Coast region of New Zealand, from 1970–1980. Blue lines represent linear trends in percentage infected herds before (solid line) and after (dashed line) commencement of intensive possum control in autumn 1972 (black arrow). (J. Edington2, pers. comm.).
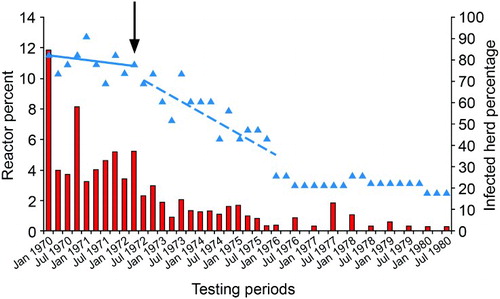
Figure 2. Direct and indirect pathways for spread of bovine tuberculosis between and within species in New Zealand. Bold arrows indicate a main source or route of infection; brown depicts direct transmission, green depicts indirect transmission via scavenging or investigation of tuberculous carcasses and offal, and red indicates that the source of infection is unknown but likely to be by direct means.
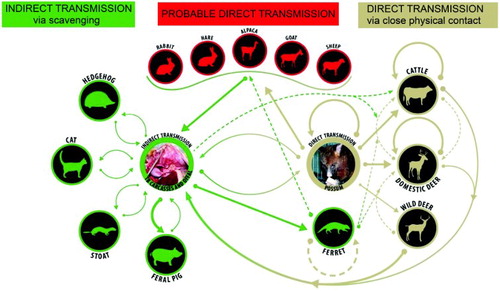
Figure 3. Locations, estimated area in hectares and dates when possums with tuberculosis were first found in New Zealand, until 1980 (from Anonymous Citation1976, Citation1978; Adlam Citation1977; Batcheler and Cowan Citation1988), together with the type of possum control undertaken during the period 1972–1980. Information collated by PG Livingstone from a range of internal MAF reports. The information contained in this Figure uses GIS mapping and therefore provides an accurate representation of the area where infection was found during the period 1967–1980.
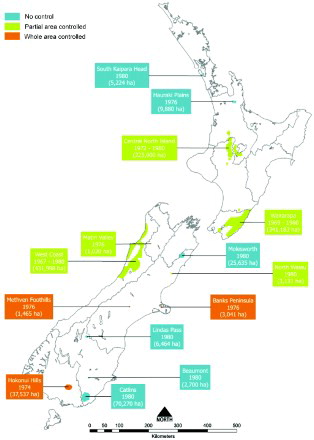
Figure 4. Boundary locations of areas in which tuberculosis (TB) was identified, or was strongly suspected to be present, in possums in New Zealand, showing the maximum size of the areas during 1980 (dark blue), 1994 (green), 2005 (sky blue), and the additional area identified in 2012 (orange). A number of the areas were subsequently declared free of TB or their size was reduced following the eradication of TB from the possum population. These changes are not shown on the map. This Figure uses the 1980 boundary from and then uses additional information compiled by PG Livingstone to define the boundaries for 1994, 2005 and 2012, based on GIS mapping.
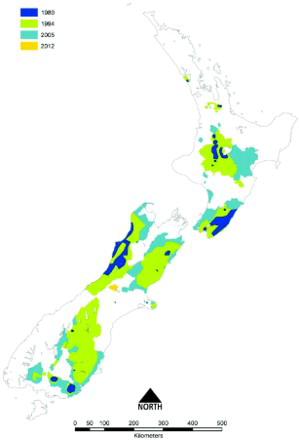
Table 3. Locations, dates and Euclidean (straight line) distances between a newly located possum infected with tuberculosis (TB) and the closest known possums with TB through contiguous possum habitat, for various locations in New Zealand (unpublished data, PG Livingstone).
Figure 5. Number of cattle tested for tuberculosis that had a positive skin-test reaction (reactors) per 10,000 animals tested between 1975/76 and 1980/81. Information collected by PG Livingstone from various historical documents relating to the then Animal Health Division of the Department of Agriculture.
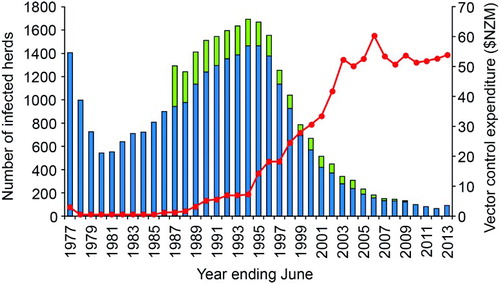
Figure 6. Number of cattle (blue bars) and deer (green bars) herds infected with tuberculosis in New Zealand for the period 1976/77 to 2012/13, with annual expenditure (NZ$ million) on vector control (red line) over the same period. Initially this was for possum control and management, but subsequently increasing amounts were spent on monitoring possum density (from 1998), and wildlife surveillance (from 2006). Figure reproduced from Hutchings et al. (Citation2013), with permission.