Figures & data
Table 1. Lameness scoring descriptors used in a study of lameness recovery rates following treatment of dairy cattle with claw horn lesions on 5 farms from the Waikato region of New Zealand (adapted from DairyNZ lameness scoring system; DairyNZ Citation2023).
Table 2. Descriptive statistics (number (n) and percentage) of the population of enrolled dairy cattle with claw horn lameness across two dairy seasons (n = 241) recorded as part of a study of lameness recovery rates following treatment on 5 farms from the Waikato region of New Zealand.
Figure 1. Kaplan–Meier estimate of cumulative survival curve and risk table for the days to become sound (lameness score = 0, adapted from DairyNZ Citation2023) following treatment for dairy cattle (n = 241) with claw horn lesions on five farms in the Waikato region of New Zealand. The shaded area represents 95% log-log CI, and the + are right-censored animals.
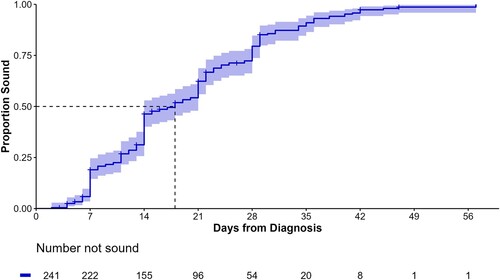
Table 3. Kaplan–Meier non-parametric cumulative survival probability (with 95% CI) for probability of soundness (lameness scoreTable Footnotea (LS) = 0) and probability of non-lame (LS ≤ 1) at 7, 14, 21, 28 and 35 days after enrolment in a study of lameness recovery rates following treatment of dairy cattle with claw horn lesions on 5 farms from the Waikato region of New Zealand.
Figure 2. Cumulative survival curve from a Cox proportional-hazard model for the days to become sound (lameness score = 0, adapted from DairyNZ Citation2023) following treatment for dairy cattle (n = 241) with claw horn lesions on each of five farms in the Waikato region of New Zealand.
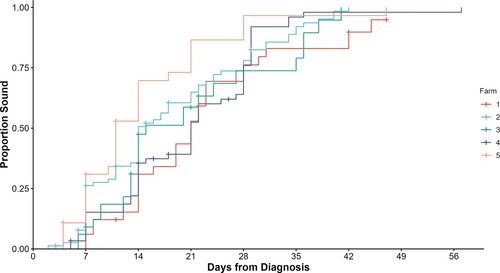
Table 4. Results of final Cox proportional-hazards semi-parametric regression model predicting hazard rate ratio (HRR) for return to soundness following treatment of dairy cattle (n = 241) with claw horn lesions on five farms in the Waikato region of New Zealand.
Table 5. Results of univariable Cox proportional-hazards semi-parametric regression models predicting hazard rate ratio (HRR) for return to soundness following treatment of dairy cattle (n = 241) with claw horn lesions on five farms in the Waikato region of New Zealand.
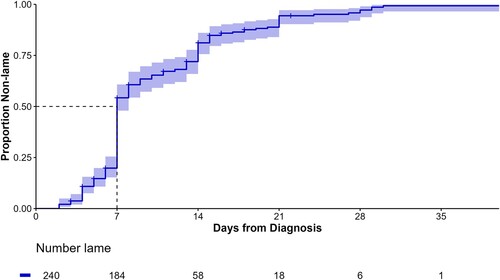
Figure 3. Kaplan–Meier estimate of cumulative survival curve and risk table for the days to become non-lame (lameness score ≤ 1, adapted from DairyNZ Citation2023) following treatment for dairy cattle (n = 241) with claw horn lesions on five farms in the Waikato region of New Zealand. The shaded area represents 95% log-log CI, and the + are right-censored animals.