Figures & data
Figure 1. Least square mean (±SE) concentration of firocoxib in plasma after IM (dotted line; 1 mg/kg) and oral (solid line; 1 mg/kg) administration to unweaned lambs (n = 15 lambs per group) undergoing hot-iron tail docking and rubber ring castration. Asterisks indicate that the mean values for the two routes of administration differed (p < 0.05) at 1, 6 and 8 hours after administration.
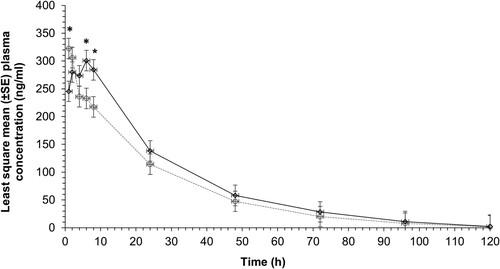
Figure 2. Least square mean (±SE) plasma concentrations of meloxicam after IM (1 mg/kg) administration to unweaned lambs (n = 15 lambs) undergoing hot-iron tail docking and rubber ring castration.
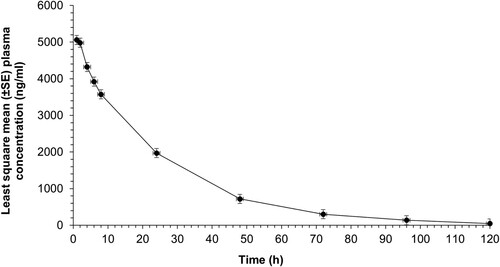
Table 1. Least squares mean (±SE)Table Footnotea pharmacokinetic parameters of firocoxib and meloxicam following oral or IM administration to lambs (n = 15, 3–6 weeks old) at a dose of 1 mg/kg.
Figure 3. Least square mean (±SE) plasma concentrations of urea (a) and creatinine (b) after administration of IM firocoxib (solid black line; 1 mg/kg), oral firocoxib (dotted black line; 1 mg/kg), IM meloxicam (solid grey line; 1 mg/kg), saline (black dashdot line) to lambs (n = 15 lambs per group) that were castrated and docked on Day 0 or that were neither castrated nor docked (sham, n = 15; grey dashdot line). Mean urea and creatinine concentrations in plasma after tail docking and castration differed (Bonferroni-corrected p < 0.05) from baseline values in the meloxicam group.
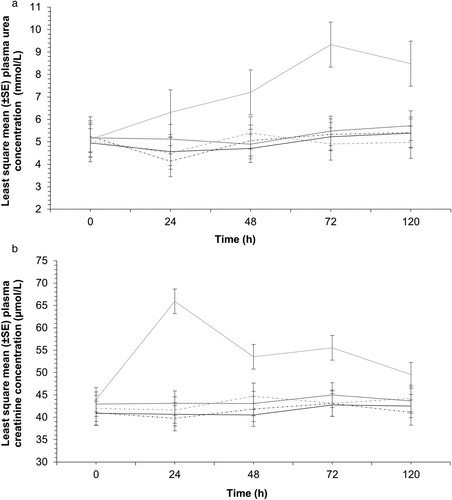
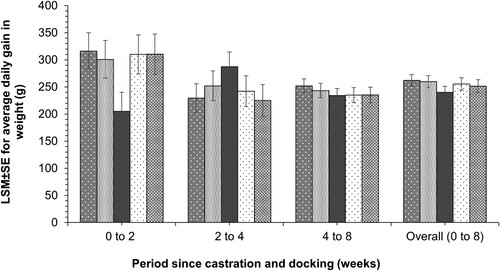
Figure 4. Least square mean (±SE) average daily gain (ADG) in body weight during different time-periods in groups of lambs (n = 15 per group) that were treated with an analgesic drug (firocoxib IM: 
 , meloxicam IM:
  ) or and saline (oral:
  ) and then docked and castrated, or not (sham:
  ). ADG in the meloxicam IM group during 0–2 weeks following castration and docking was (Bonferroni-corrected p < 0.05) lower than the other groups. There were no between-group differences in ADG during 2–4 weeks or 4–8 weeks or overall period (0–8 weeks).