Figures & data
Figure 1. (A) Stereolithographic file of the computer aided design, additively manufactured (AM) plate. (B) Selective laser melting printed Ti–A6–V4 AM 1.5/2.0 mm limited contact plate (LCP; top of image) and conventionally manufactured (CM) Arix titanium alloy 1.5/2.0 mm LCP from an in vitro analysis comparing the biomechanical properties of titanium alloy AM and CM plate-screw constructs.
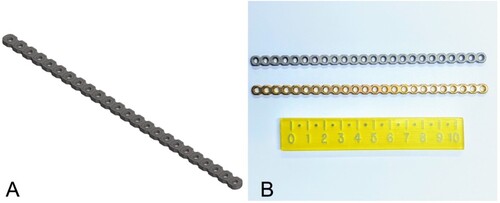
Figure 2. Photograph of a plate-screw construct consisting of a 6-hole conventionally manufactured (CM) plate screwed to polyoxymethylene rods with a 2-mm osteotomy gap in the custom 4-point bending jig from an in vitro study comparing the biomechanical properties of titanium alloy additively manufactured, 3D printed and CM plate-screw constructs.
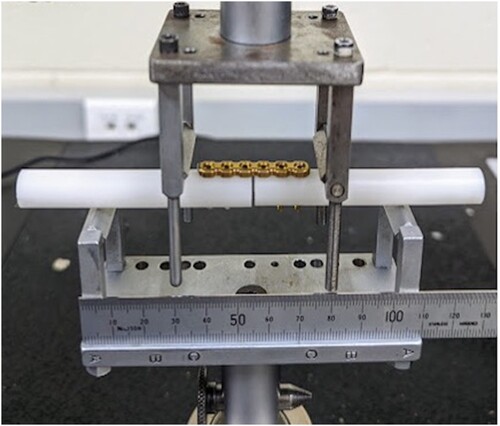
Figure 3. Photographs of mechanical set up for single-cycle load to failure (A) and cyclic fatigue (B) testing of the biomechanical properties of titanium alloy additively manufactured, 3D printed and conventionally manufactured plate-screw constructs. In both images, a plate construct is positioned for testing in the 4-point bending test jig.
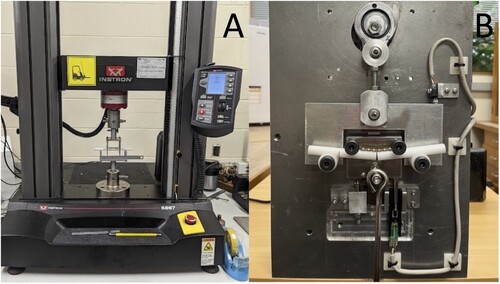
Figure 4. Box-and-whisker plots comparing bending stiffness (A), bending structural stiffness (B), 0.2% off-set yield load (C), and bending strength (D) of titanium alloy additively manufactured (AM; n = 7) and conventionally manufactured (CM; n = 7) plate-screw constructs tested in four-point bending, single-cycle, load-to-failure in vitro. The upper and lower edges of the boxes indicate the 25th and 75th percentiles, respectively, the upper and lower whiskers indicate the 1st and 99th percentiles, respectively and the median is shown by the horizontal line inside the boxes. Different letters above each box plot indicate differences (p < 0.05) by Wilcoxon (Mann–Whitney) rank sum test.
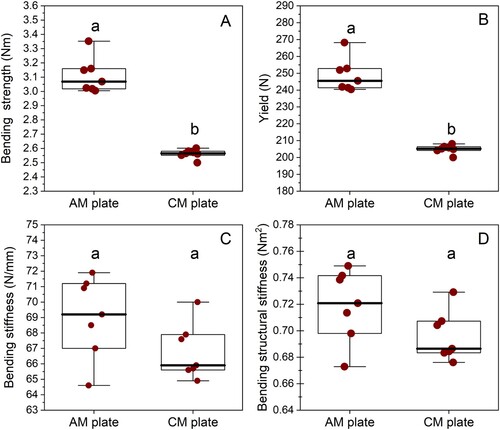
Figure 5. Load–displacement curves for conventionally manufactured (CM; dotted line; n = 7) and additively manufactured (AM; solid line; n = 7) plate-constructs tested in single-cycle load to failure in an in vitro comparison of the biomechanical properties of titanium alloy AM and CM plate-screw constructs.
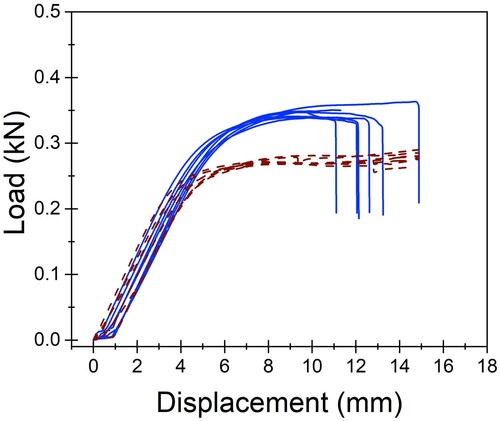
Figure 6. Box-and-whisker plots comparing the number of cycles before failure of conventionally manufactured (n = 4) and additively manufactured (n = 5) titanium alloy plate-screw constructs tested by cyclic fatigue in vitro. The upper and lower edges of the boxes indicate the 25th and 75th percentiles, respectively, the upper and lower whiskers indicate the 1st and 99th percentiles, respectively, and the median is shown by the horizontal line inside the boxes. Different letters indicate differences between plate types (p < 0.05) by Wilcoxon (Mann–Whitney) rank sum test.
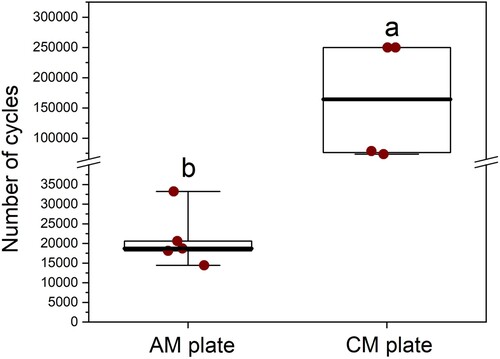
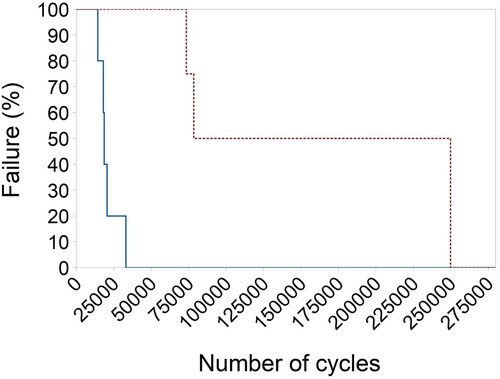
Figure 7. Kaplan–Meier survival curves for the additively manufactured (solid line; n = 5) and conventionally manufactured (dotted line; n = 4) titanium alloy plate-screw constructs tested by dynamic fatigue testing. A vertical drop in the curves indicates a plate failure event.