Figures & data
Figure 1. Causal diagram demonstrating the hypothesised relationships between the risk of humeral fracture and variables carried forward from a univariable analysis of farm and management factors associated with the risk of humeral fracture in dairy heifers. Dashed grey arrows show possible pathways for which there is less evidence.
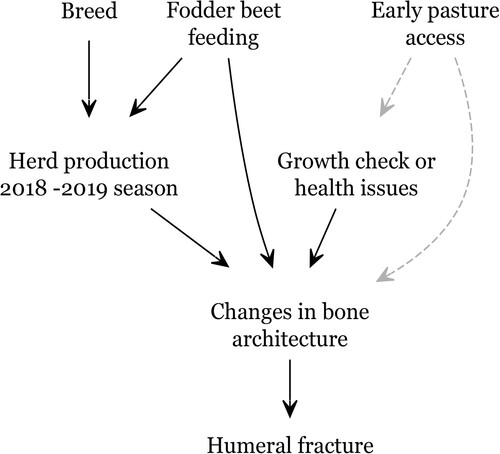
Figure 2. Map of New Zealand showing the geographical location of farms that did (case; black squares) or did not (control; grey triangle) report cases of humeral fractures among dairy heifers. Four farms (two case and two control) are not shown due to farmers withholding their locations. Clusters of case farms are observed in the Waikato and Canterbury regions and clusters of control farms are observed in the Taranaki and lower South Island regions.
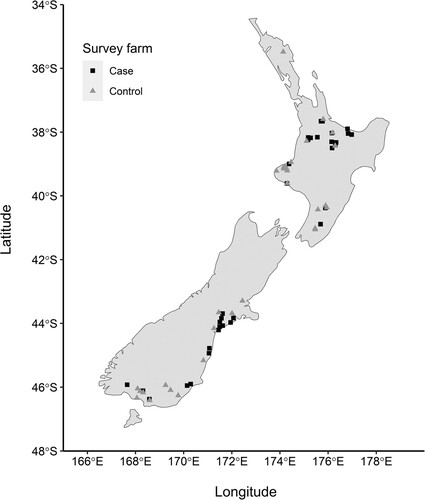
Table 1. Results of univariable logistic regression for association of farm characteristics and management factors with the unadjusted OR (95% CI) for risk of a farm having cases of spontaneous humeral fracture in dairy heifers.
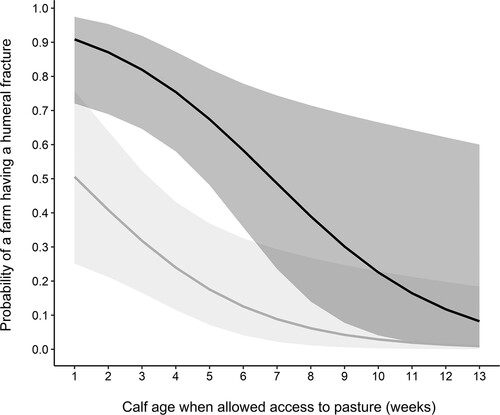
Figure 3. Graph showing the change in probability of humeral fracture among heifers for a farm where Holstein-Friesian Jersey crossbreed is the main breed of dairy cow (black line and dark 95% CI) or not (grey line and light grey 95% CI), over the range of ages that calves first had access to pasture.