
Figures & data
Table 1. The number of enrolled farms and cows that were tail scored across nine regions of New Zealand to investigate the prevalence of tail damage on dairy farms.
Table 2. Median, IQR and range of the prevalence of tail damageTable Footnotea from 92,348 cows across 200 farms from nine regions in New Zealand.
Figure 1. Boxplots summarising tail scoring data using a modified version of the New Zealand Veterinary Association Industry Scoring System (Anonymous 2021a) from 92,348 cows on 200 farms across 9 regions of New Zealand for the prevalence of deviated tail damage (non-linear deformity: top facet) and traumatic tail damage (all damage except deviation and shortening: bottom facet) by region and split by location of damage on the tail (Upper (blue/dark grey), middle (yellow/white) or lower (red/light grey) third of the tail). All lesions on a tail were recorded so a cow could have more than one lesion type and location, and/or multiple lesions of the same type. Each box represents the 25th and 75th percentile with the median marked by a horizontal line. Each whisker extends to 1.5 times the IQR and outliers outside this point are marked by solid grey dots. To view the figure in colour please see the online version.
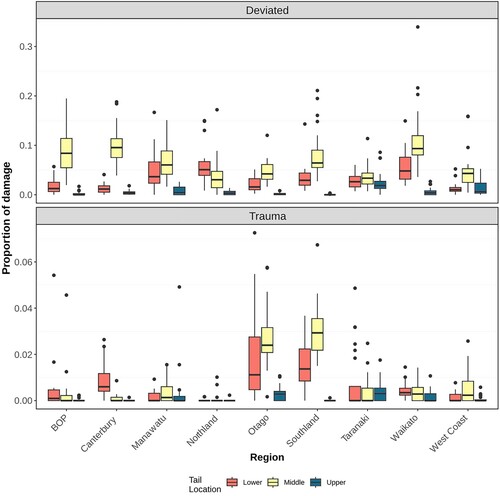
Table 3. The proportion of cows (n = 92,348) from 200 farms across nine regions in New Zealand with deviated (non-linear deformity), tail shorteningTable Footnotea, or traumatic (all other lesions) tail damageTable Footnoteb for the lower, middle and upper third of the tail. The percentage of each lesion type at each position is shown in parentheses.
Table 4. The required number of animals to sample to achieve the stated level of precisionTable Footnotea.
Table 5. Bootstrap sampling distribution for different sampling scenarios (front of herd, back of herd and randomly throughout the herd) compared to the herd-level prevalence of tail damage estimated from 92,348 cows across 200 farms and 9 regions of New Zealand.