Figures & data
Figure 1. Histograms depicting fold change in liver mRNA expression for GSTA3 (A), GSTM1 (B), GSTP1 (C) and mGST2 (D) after 1, 2, 3 and 4 days of treatment with vehicle (white bars) or 100 mg/kg (black bars) of ATR. Data are presented as mean ± SEM; *significant difference (p < 0.05) versus corresponding day control group.
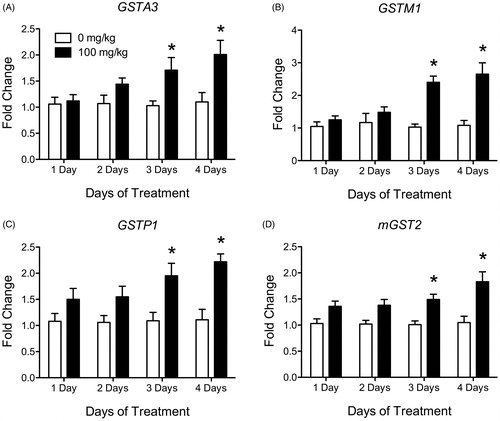
Table 1. Liver GST mRNA expression levels (±SEM) in atrazine treated rats summary values in fold change.
Figure 2. Histogram depicting density ratio to beta actin levels of liver GST isoform proteins (A) GST mu, (B) GST pi, (C) GST alpha and (D) GST omega levels after 1, 2, 3 and 4 days of treatment with vehicle (white bars) or 100 mg/kg (black bars) of ATR. Data are presented as mean ± SEM; *significant difference (p < 0.05) versus corresponding control.
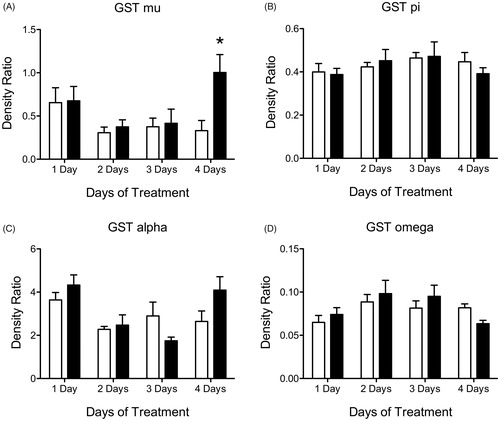
Figure 3. Histogram depicting liver (A) glutathione (GSH) levels in nmoles/mg protein, (B) liver cytosolic GST (cGST) activity in nmol/min/mg protein and (C) liver microsomal GST (mGST) activity in nmol/min/mg protein for all animals after 1, 2, 3 and 4 days of treatment with vehicle (white bars) or 100 mg/kg (black bars) of ATR. Data are presented as mean ± SEM; *significant difference (p < 0.05) versus corresponding control group.
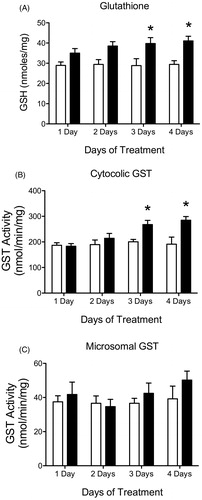
Figure 4. Histograms depicting fold change in liver mRNA expression for (A) CYP2B2, (B) CYP2B3, (C) CYP2E1, (D) CYP2R1, (E) CYP3A18 and (F) CYP27A1 after 4, 8 and 14 days of treatment with vehicle (white bars), 6.5 mg/kg (light gray), 50 mg/kg (dark gray) or 100 mg/kg (black bars) of ATR. Data are presented as mean ± SEM; significant difference (p < 0.05; *compared to 0 mg/kg).
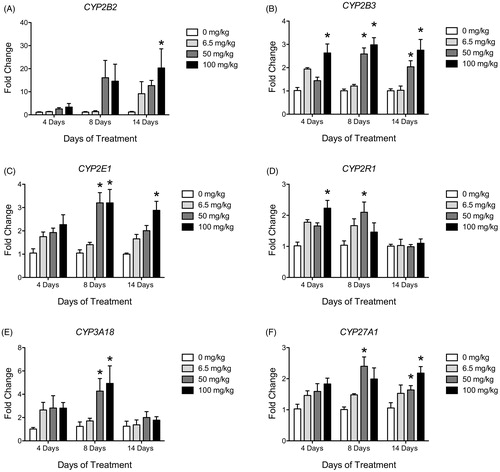
Table 2. Liver cytochrome P450 enzyme mRNA expression levels (±SEM) in atrazine treated rats summary values in fold change.
Figure 5. Histograms depicting fold change in liver mRNA expression for (A) CYP2B2, (B) CYP2B3, (C) CYP2E1, (D) CYP2R1, (E) CYP3A18 and (F) CYP27A1 after 4, 8 and 14 days of treatment with vehicle (white bars), 6.5 mg/kg (light gray), 50 mg/kg (dark gray) or 100 mg/kg (black bars) of ATR. Data are presented as mean ± SEM; significant difference (p < 0.05; *compared to 0 mg/kg).
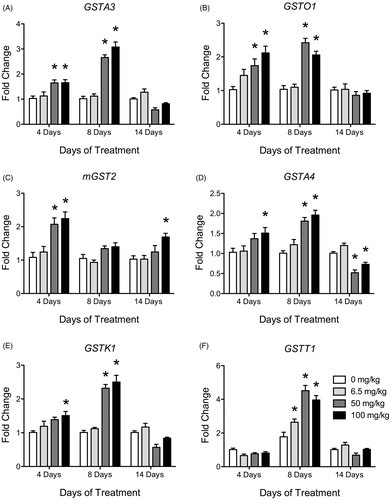
Table 3. Liver GST mRNA expression levels (±SEM) in atrazine treated rats summary values in fold change.
Figure 6. Histogram depicting density ratio to beta actin levels of liver GST isoform proteins (A) GST mu, (B) GST pi, (C) GST alpha and (D) GST omega levels after 4, 8 and 14 days of treatment with vehicle (white bars), 6.5 mg/kg (light gray), 50 mg/kg (dark gray) or 100 mg/kg (black bars) of ATR. Data are presented as mean ± SEM; *significant difference (p < 0.05) versus corresponding control.
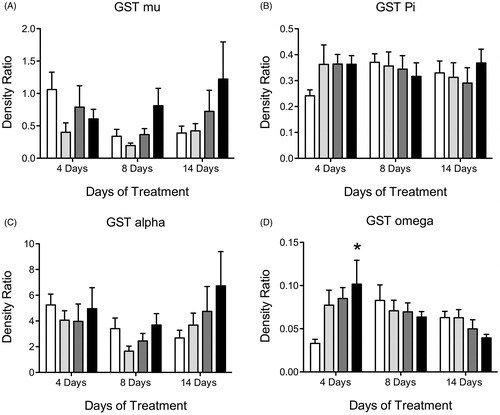
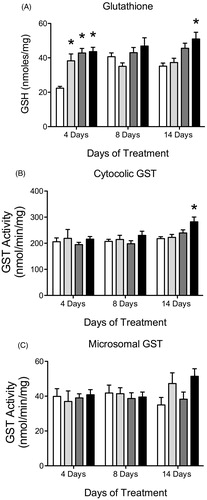
Figure 7. Histogram depicting liver (A) GSH levels in nmoles/mg protein, (B) cytosolic GST (cGST) activity in nmol/min/mg protein and (C) microsomal GST (mGST) activity in nmol/min/mg protein for all animals after 4, 8 and 14 days of treatment with vehicle (white bars), 6.5 mg/kg (light gray), 50 mg/kg (dark gray) or 100 mg/kg (black bars) of ATR. Data are presented as mean ± SEM; *significant difference (p < 0.05) versus control.