
Figures & data
Table 1. Preparation of Hu-Liver cells from chimeric mice with humanised livers.
Figure 1. Comparison of the morphology of human hepatocytes and Hu-Liver cells. Phase contrast images show human hepatocytes (lot A) and Hu-Liver cells prepared from a Hu-Liver mouse (A1) at 24 h after plating (scale bar =50 μm).
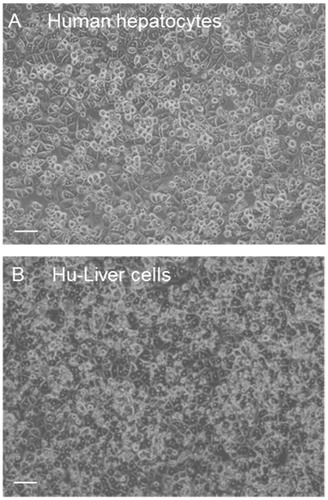
Figure 2. Change in CYP3A4 mRNA levels during week-long culture of Hu-liver cells and human hepatocytes. Data are expressed as the ratio of the CYP3A4 mRNA to GAPDH mRNA. Data represent the mean of duplicate determinations. Open circles, closed triangles, closed squares and closed diamonds show donor A human hepatocytes and Hu-liver cells A2, A3 and A1, respectively.
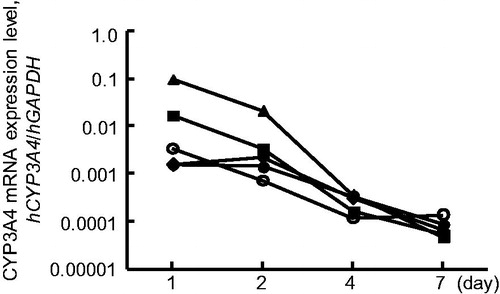
Figure 3. Correlation of human P450 mRNA expression levels in human hepatocytes with those in Hu-Liver cells. The expression levels of human CYP1A2, CYP2A6, CYP2B6, CYP2C8, CYP2C9, CYP2C19, CYP2D6, CYP2E1, CYP2J2, CYP3A4, CYP3A5, CYP4A11, CYP4F2, CYP4F3B, CYP4F11 and CYP4F12 mRNAs in human hepatocytes and Hu-Liver cells after culture incubation for 48 hours are shown on the y axis and x axis, respectively. P450 mRNA expression levels showed significant correlation (p < .001) between human hepatocytes and Hu-Liver cells. Data represent the mean ± standard deviation of triplicate determinations. The solid line passing through the origin represents unity and the dashed lines represent five-fold differences above and below unity.
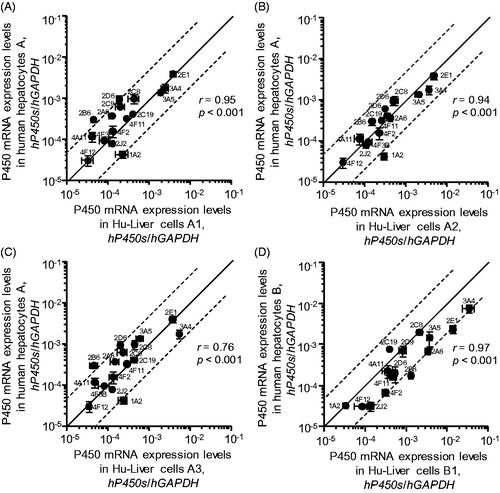
Figure 4. Induction of human CYP1A2, CYP2B6, CYP2C8, CYP2C9, CYP2C19 and CYP3A4 mRNAs in human hepatocytes and Hu-Liver cells by typical human P450 inducers. Induction of human CYP1A2 (A), CYP2B6 (B), CYP2C8 (C), CYP2C9 (D), CYP2C19 (E) and CYP3A4 (F) mRNAs in human hepatocytes and Hu-Liver cells by typical human P450 inducers: omeprazole, CYP1A2; phenobarbital, CYP2B6, CYP2C8, CYP2C9 and CYP2C19; rifampicin, CYP3A4. Each human P450 mRNA level was normalised to the human GAPDH mRNA level. Data represent the mean values of duplicate determinations. Open and closed bars show data for control samples and inducer-treated samples, respectively.
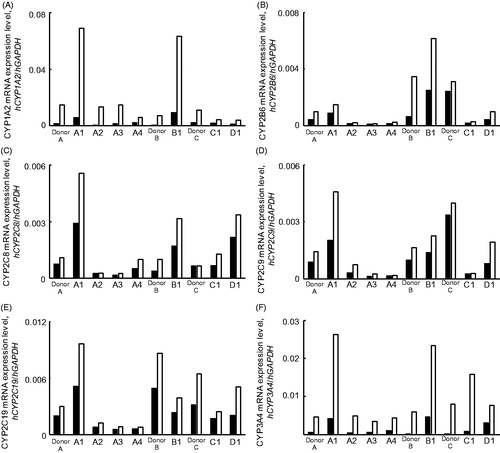
Table 2. Fold induction of human CYP1A2, CYP2B6, CYP2C8, CYP2C9, CYP2C19 and CYP3A4 mRNAs in three lots of human hepatocytes and seven lots of Hu-Liver cells.
Figure 5. Expression levels of CYP3A4 mRNA in human hepatocytes and Hu-Liver cells treated with eight chemical inducers. Human hepatocytes and Hu-Liver cells were treated with omeprazole (50 μM), β-naphthoflavone (50 μM), CITCO (1 μM), phenobarbital (1000 μM), rifampicin (10 μM), pregnenolone 16α-carbonitrile (PCN) (10 μM), phenytoin (250 μM) and flumazenil (50 μM) for 48 h. Flumazenil was used as a negative control for CYP3A4 mRNA induction (Ramachandran et al., Citation2015). Data represent the mean of duplicate determinations. The dashed line represents data (one-fold) from the control sample (0.1% DMSO).
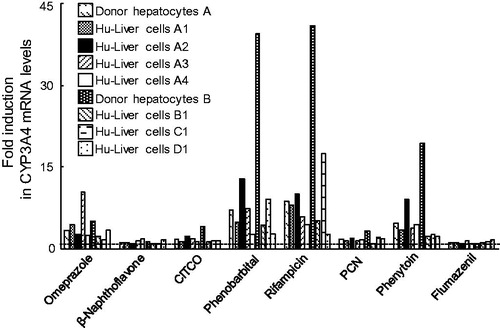
Figure 6. Dose–response curves of CYP3A4 mRNA expression in human hepatocytes and Hu-Liver cells when treated with rifampicin. Expression levels of CYP3A4 mRNA were determined in human hepatocytes of lot A (open circles) and Hu-Liver cell lots A1 (closed circles), A2 (closed triangles) and A4 (closed diamonds) treated with rifampicin concentrations between 0.28 and 50 μM. Solid and dashed lines represent curve-fitting of the data for the human hepatocytes and Hu-Liver cells, respectively. Data represent the mean of duplicate determinations.
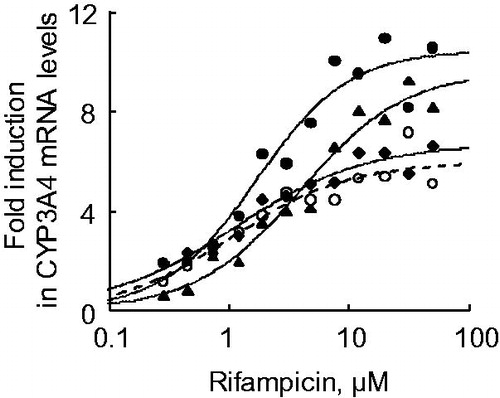
Figure 7. Testosterone 6β-hydroxylation activities in human hepatocytes and Hu-Liver cells treated with rifampicin. Filled and open squares indicate basal (0.1% DMSO-treated) and 20 μM rifampicin-treated hepatocyte lots, respectively. The fold induction in testosterone 6β-hydroxylation activities in human hepatocytes lot A and Hu-Liver cells lots A1, A2 and A3 was 2.5, 2.7, 4.1 and 3.7, respectively. *p < .05; **p < .01; ***p < .001. Data represent the mean ± standard deviation of triplicate determinations.
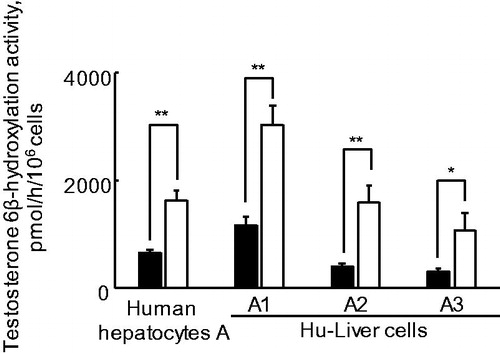
Table 3. EC50 and Emax values for the induction of CYP3A4 mRNA by rifampicin in human hepatocytes and Hu-Liver cells.