
Figures & data
Figure 1. Flow chart of high throughput assay starting from incubation and separation of hepatocytes from the media via an oil spin method (steps 1–4) to extraction and analysis via LC-MS (steps 5–9). Numbers in squares relate to the step number in time order as described in the Methods section. LC-MS: liquid chromatography–mass spectrometry.
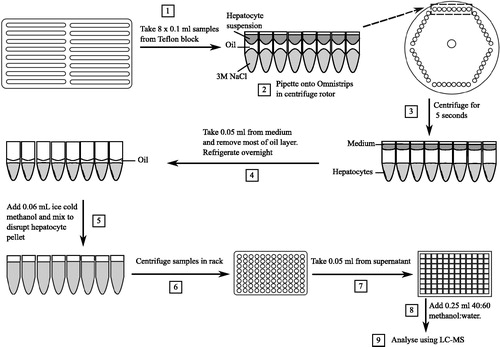
Figure 2. Schematic of the micro-rate constant models (Models 1 and 2) consisting of medium, transporter and intracellular compartments, and macro-rate constant models (Models 3 and 4) consisting of medium and intracellular compartments. Atorvastatin following pre-incubation with CsA with competitive (a and c) and non-competitive (b and c) inhibition of uptake respectively were modelled. CsA: cyclosporine.
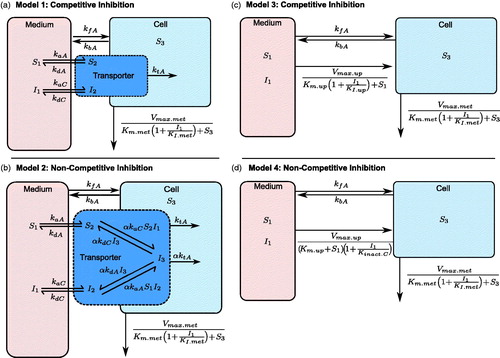
Table 1. Structural identifiability of the micro-rate constant models and macro-rate constant models, and goodness of fit values obtained during parameter estimation (Models 1–4).
Figure 3. Plots of atorvastatin cellular concentration against time following the addition of atorvastatin (0.05, 0.25, 0.5, 2.5, 5, 25, 50 and 150 nmol/ml) in the absence (circles) and presence (triangles) of 10 nmol/ml of CsA. Each time course represents one experiment from one Teflon block trough. Shapes are data from the three separate experiments, the solid line and dashed line is the average individual prediction from Model 2 in the absence and presence of 10 nmol/ml of CsA, bounded by the max and min individual predictions (shading). CsA: cyclosporine.
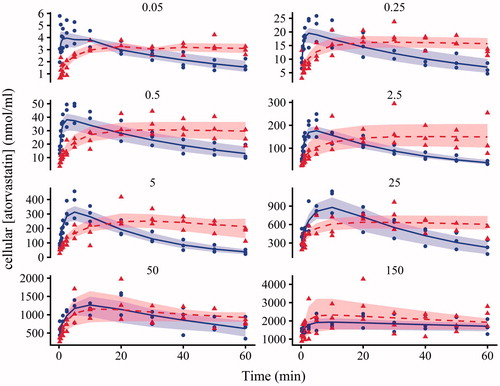
Figure 4. Plot of individual weighted residuals (IWRES) against time for Model 2 obtained using Monolix 2018R2. Points are IWRES, dashed lines are 95% confidence intervals and solid line is the locally estimated scatterplot smoothing of the IWRES.
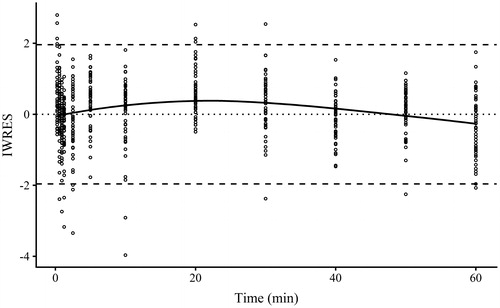
Figure 5. Model 2 plots of the simulated amounts of atorvastatin bound to the transporter against time in the absence (dotted line) and presence (solid line) of cyclosporine (CsA). The dotted-dashed line is the amount of CsA bound to the transporter following pre-incubation, and the dashed line is the atorvastatin–transporter–CsA complex.
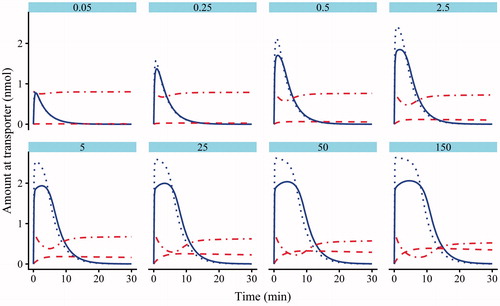
Table 2. Micro-rate constant model parameter estimates for the non-competitive inhibition of atorvastatin by CsA in rat hepatocytes (Model 2).