Figures & data
Table 1. In vitro activity of bexagliflozin and its principal human metabolites.
Table 2. Distribution of radiolabel among parent compound and metabolites in rats, monkeys and humans.
Table 3. Relative proportions of metabolites in male and female cynomolgus monkeys.
Figure 1. Plasma concentration of total radioactivity in plasma, blood and as bexagliflozin in plasma as a function of time from dose administration in humans.
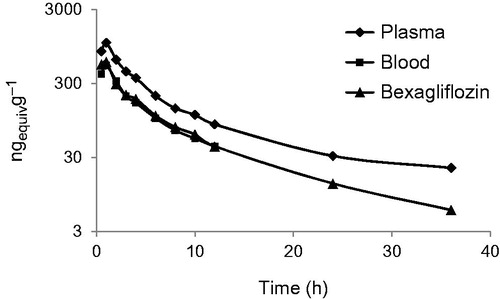
Table 4. Pharmacokinetic parameters for bexagliflozin and its principal metabolites in humans, as inferred by distribution of 14C-labelled material.
Figure 2. Representative radiochromatograms of human samples. Radiochromatograms depicting the nine discrete human specimen peaks are shown. Peak identifications: 1, metabolite HM1; 2, EGT0001301; 3, EGT0001494; 4, metabolite HM2; 5, EGT0002147; 6, EGT0001663; 7, EGT0002148; 8, EGT0002149; 9, bexagliflozin.
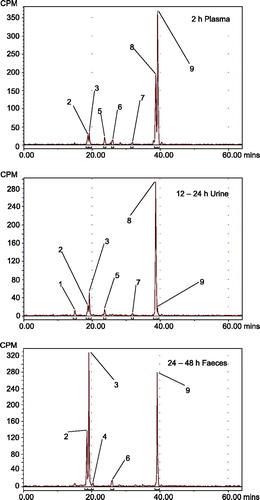
Figure 3. Metabolic fate of bexagliflozin in rats, monkeys and humans. The principal metabolites of the parent compound bexagliflozin in SD rats, cynomolgus monkeys and healthy human subjects are displayed above. The percentages represent the plasma AUC proportionality relative to bexagliflozin.
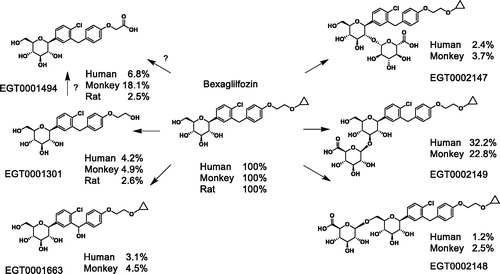
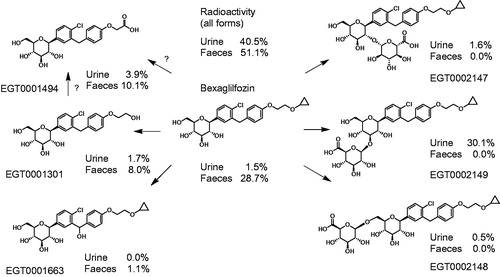
Figure 4. Relative disposition of bexagliflozin in human excreta. The percentages shown represent the proportion of input radioactivity recovered in the specified form.