
Figures & data
Figure 1. Substrate and product fluorescence in COMT mediated O-methylation catalysis of esculetin to scopoletin or isoscopoletin. The weakly fluorescent esculetin is 6-O-methylated to the highly fluorescent scopoletin and 7-O-methylated to the non-fluorescent isoscopoletin (panel A). Panel B shows the effect of pH on the fluorescence of esculetin, scopoletin, and isoscopoletin at excitation 405 nm and emission 460 nm wavelengths. The fluorescence of 1 µM scopoletin is dependent on the type of the 100 mM buffer at pH 7.4 and incubation time (panel C). The fluorescence values of scopoletin, esculetin, or sum of scopoletin (0 →10 µM) and esculetin (10 → 0 µM) are linearly dependent on the concentration (panel D).
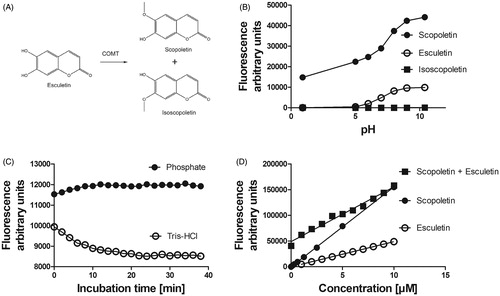
Figure 2. Factors affecting the esculetin 6-O-methylation reaction. Panel A shows the increase in fluorescence when 10 µM of esculetin is incubated in 100 mM phosphate buffer pH 7.4 containing rat liver cytosol (high activity sample) or brain (low activity sample), 5 mM of MgCl2, and 100 µM of SAM. Panel B displays the increase in the scopoletin concentration in the reaction sample, whereas no scopoletin is formed in the negative controls without SAM or cytosol, after the standardisation of fluorescence to the scopoletin concentration. Panel C shows the effect of the amount of cytosolic protein on the formation of scopoletin. Panel D shows the correlation between the scopoletin concentrations determined with the fluorescence assay and with the LC-MS analysis after incubation of esculetin with human, mouse, rat, dog, rabbit, pig, and sheep liver cytosols. Panels E and F provide details of enzyme kinetics of esculetin 6-O-methylation with respect to the cofactor, S-adenosylmethionine and the substrate, esculetin, in rat liver cytosol, respectively.
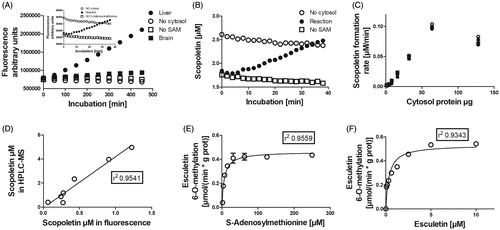
Figure 3. The esculetin 6-O-methylation rate in liver cytosols and microsomes of different animal species. The activities were determined with the continuous esculetin 6-O-methylation fluorescence assay with 10 µM of esculetin in 100 mM phosphate buffer pH 7.4 containing liver cytosol or microsomes from the different species, in the presence of 5 mM of MgCl2, and 100 µM of SAM (panels A–C). In panels D and E, the incubation was stopped after 30 min, and then the concentrations of scopoletin and isoscopoletin were determined by LC-MS analysis. Panels A–C show individual observations and the error bars represent mean ± SEM, panels D and E are mean ± SEM.
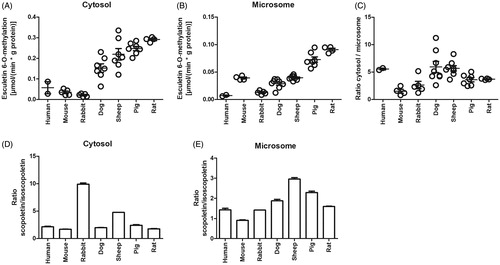
Figure 4. Esculetin 6-O-methylation rates in different rat tissues. The activity was determined with the continuous fluorescence monitoring for 450 min. The incubation mixture consisted of 10 µM of esculetin, 100 mM of phosphate buffer pH 7.4, liver cytosols (A), microsomes (B), or S9 fraction (C) of different tissues, 5 mM of MgCl2, and 100 µM of SAM (n = 8 in A and B). In panel C, there is a statistical difference in the methylation rates of esculetin between the hippocampus and cortex (n = 3; one-way ANOVA followed by Tukey’s multiple comparison test, p < 0.05). The error bars represent the 95% confidence levels.
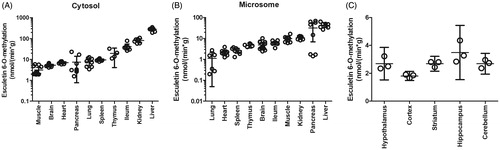
Table 1. Total COMT activities as measured by esculetin 6-O-methylation rates in ten different rat tissues (mean ± standard deviation, n = 8).
Figure 5. The inhibition of esculetin 6-O-methylation in liver cytosol of human and rat by entacapone and tolcapone. The inhibition of scopoletin formation was determined in 100 mM phosphate pH 7.4 buffer containing 10 mM of MgCl2, cytosolic protein, 100 µM of PAPS, 10 µM of esculetin, and the indicated concentration of entacapone or tolcapone. In panels A and B, the experiment was performed without preincubation, and in panels C–F entacapone or tolcapone were first incubated without esculetin for 20 min at 37 °C, and then 10 µM of esculetin was added and the esculetin 6-O-methylation rate was determined with the indicated inhibitor concentrations.
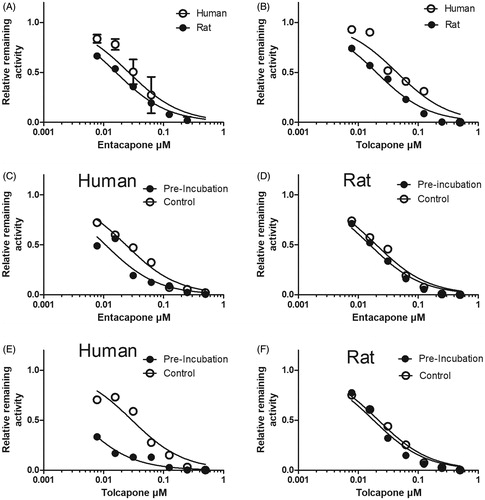
Table 2. The IC50 values (µM; 95% confidence level) of entacapone and tolcapone of hepatic cytosolic COMT in different species.
Table 3. The effect of preincubation of entacapone and tolcapone on their IC50-values (µM; 95% confidence limit) against liver cytosol esculetin 6-O-demethylation in human and rat.
Figure 6. The effects of the cytosolic protein and esculetin concentrations on the IC50 values of entacapone and tolcapone in rat liver cytosol. The inhibition of esculetin 6-O-methylation was determined in 100 mM phosphate pH 7.4 buffer containing 10 mM of MgCl2, the cytosolic protein, 100 µM of PAPS, the indicated concentration of esculetin, and 0 – 1 µM of entacapone or tolcapone. In panel A, the cytosolic protein concentration varied between 0.1 and 0.6 g/L, and 10 µM esculetin was used as a substrate. In panels B and C, the cytosolic protein concentration was 0.2 g/L, and the esculetin concentration varied between 0 and 10 µM.
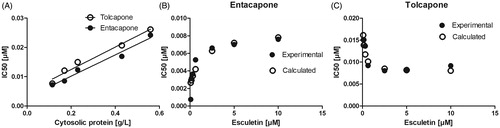
Table 4. Inhibition constants Kiu and Kic of entacapone and tolcapone for COMT catalysed esculetin 6-O-methylation in rat liver cytosol.