
Figures & data
Figure 1. Chemical structure of [14C]enerisant. Asterisk donates the position of the 14 C label.
![Figure 1. Chemical structure of [14C]enerisant. Asterisk donates the position of the 14 C label.](/cms/asset/1dd87c60-66c7-4a78-a161-a867dd1c28c0/ixen_a_1918361_f0001_b.jpg)
Table 1. Marker reactions, the concentrations of probe substrates, and the reaction times for CYP inhibition studies.
Table 2. Probe substrates, the concentrations of probe substrates, and the incubation times for transporter inhibition studies
Table 3. Plasma protein binding of [14C]Enerisant in rat, dog, and human.
Table 4. Inhibition of enerisant for CYP activities in human liver microsomes.
Table 5. Effects of enerisant and control inducers on mRNA of primary human hepatocytes after 72 h-exposure.
Table 6. [14C]Enerisant permeability and efflux ratio across P-gp-expressing MDCK cell and BCRP-expressing MDCK cell monolayers.
Figure 2. Time-dependent uptake of [14C]enerisant by cells transfected with OATP1B1 (A), OATP1B3 (B), OAT1 (C), OAT3 (D), OCT2 (E), MATE1 (F), and MATE2-K (G) compared with control cells, which were transfected with vector only. Data are represented as mean ± SD of quadruplicate.
![Figure 2. Time-dependent uptake of [14C]enerisant by cells transfected with OATP1B1 (A), OATP1B3 (B), OAT1 (C), OAT3 (D), OCT2 (E), MATE1 (F), and MATE2-K (G) compared with control cells, which were transfected with vector only. Data are represented as mean ± SD of quadruplicate.](/cms/asset/4631d7f6-4259-4346-8119-8c31057c4c01/ixen_a_1918361_f0002_b.jpg)
Table 7. IC50 values of enerisant for transporter activities in transporter-expressing cells.
Figure 3. Plasma enerisant concentration–time profiles after a single oral administration of enerisant to healthy male subjects. Data are represented as mean ± SD of six subjects.
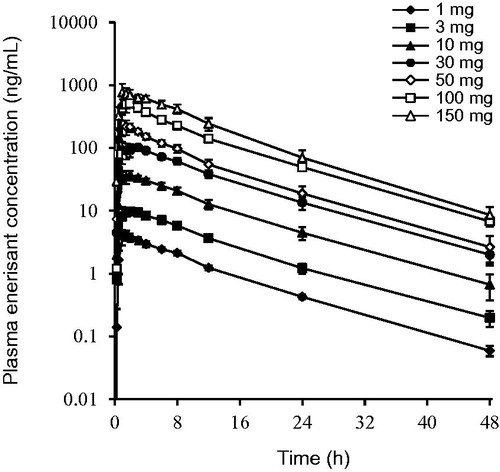
Table 8. Plasma pharmacokinetic parameters after a single oral administration of enerisant to healthy male subjects.
Table 9. Urinary excretion and renal clearance after a single oral administration of enerisant to healthy male subjects.