
Figures & data
Figure 1. Structures of emvododstat, O-desmethyl emvododstat, O-desmethyl emvododstat glucuronide, emvododstat-D3 and O-desmethyl emvododstat-D4.
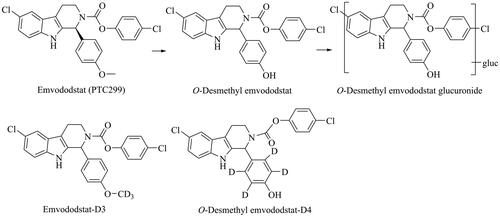
Table 1. Average percent of protein binding in plasma and blood-to-plasma concentration ratio in whole blood across four emvododstat concentrations (0.05, 0.5, 5, and 50 μg/mL).
Figure 2. Metabolite profiles of 14C-emvododstat at 2 µM after 4 h incubation with rat (A), dog (B), monkey (C), and human (D) hepatocytes.
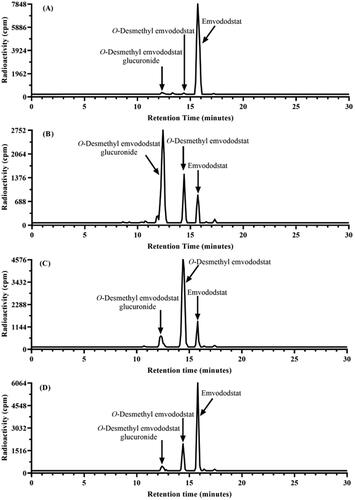
Table 2. Mean percent of total radioactivity associated with 14C-emvododstat and metabolites after 60, 120, and 240 min incubation with rat, dog, monkey, and human hepatocytes.
Table 3. O-Desmethyl emvododstat formation kinetics in recombinant human CYP enzymes and human liver microsomes (mean ± standard error, n = 3).
Table 4. Emvododstat CYP inhibition parameters in human liver microsomes.
Table 5. O-Desmethyl emvododstat CYP inhibition parameters in human liver microsomes (mean ± standard error, n = 2).
Table 6. Emvododstat and O-desmethyl emvododstat CYP induction parameters in human hepatocytes.
Figure 3. Emvododstat and O-desmethyl emvododstat plasma concentrations in (A) mice after a single 10 mg/kg oral dose of emvododstat, (B) rats and (C) dogs after a single 0.5 mg/kg IV dose or a 3 mg/kg oral dose of emvododstat, and (D) monkeys after a single 10 mg/kg oral dose of emvododstat.
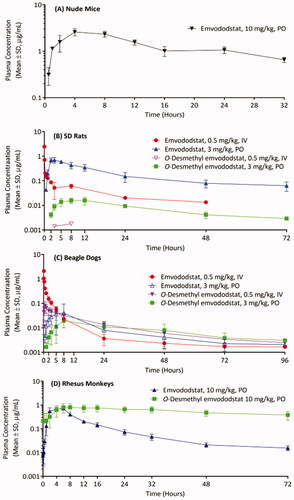
Table 7. Pharmacokinetic parameters of emvododstat and O-desmethyl emvododstat following a single IV or oral dose in mice, rats, dogs and monkeys (Mean ± SD).