
Figures & data
Figure 1. Levonorgestrel (LNG) concentration in Göttingen minipig following 30 µg via various routes of administration: intravenous (IV) bolus, IV infusion, and intradermal injection (semi-logarithmic scale). Points (i.e. shapes) represent individual observations and the lines (i.e. line types) represent the mean concentration. Any concentrations below the limit of quantitation were treated as zero values, thus affecting the overall mean concentration.
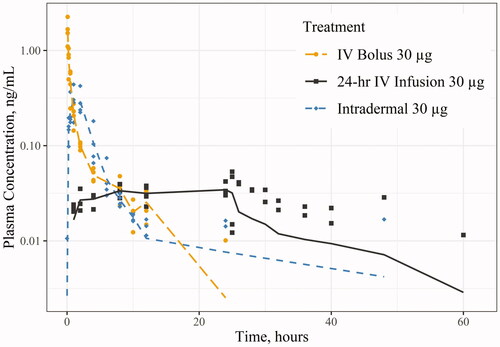
Figure 2. Levonorgestrel (LNG) concentration in Sprague-Dawley rat following 30 and 60 µg via various routes of administration: intravenous (IV) infusion, IV bolus, and subcutaneous (SC) (semi-logarithmic scale). Points (i.e. shapes) represent individual observations and the lines (i.e. line types) represent the mean concentration. Any concentrations below the limit of quantitation were treated as zero values, thus affecting the overall mean concentration.
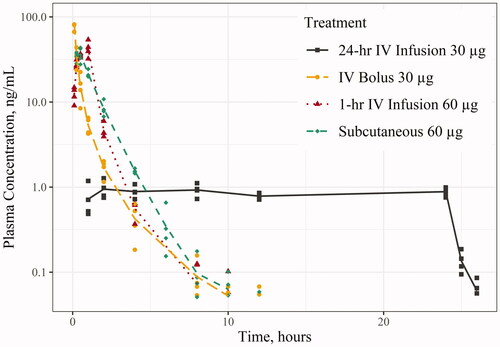
Figure 3. Etonogestrel (ENG) concentration in Sprague-Dawley rat following 30 µg via intravenous (IV) bolus and IV infusion (semi-logarithmic scale). Points (i.e. shapes) represent individual observations and the lines (i.e. line types) represent the mean concentration. Any concentrations below the limit of quantitation were treated as zero values, thus affecting the overall mean concentration.
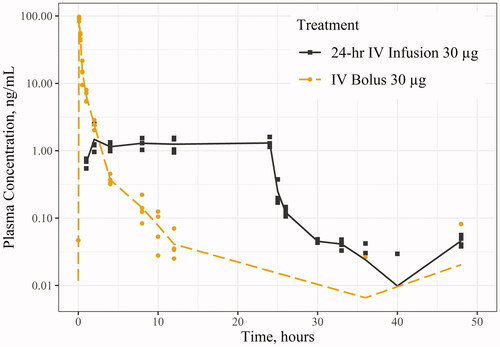
Table 1. Mean pharmacokinetic parameters following various routes of administration of LNG or ENG in rat and minipig.
Table 2. LNG and ENG PK following IV bolus in animal species from the previous studiesa.
Table 3. LNG and ENG PK following SC/IM/ID injection in animal species from the previous studiesa.
Supplemental Material
Download PDF (120.5 KB)Data availability statement
The authors confirm that the data supporting the findings of this study are available within its supplementary materials.