
Figures & data
Figure 1. Schematic of PPK and PK/PD models. The outline indicates the addition of MIC-1 to the PPK model to create the PK/PD model. PPK model equations:
C: navtemadlin concentration; FA: fraction of rate M1 excreted in the gall bladder to the total M1 elimination rate kem; FM: fraction of rate navtemadlin metabolised to M1 to the total navtemadlin elimination rate kel; GB: gall bladder; I: amount from the absorption compartment; ka: absorption rate; Hill: Hill coefficient; KBRBASAL: bile acid base release rate in gall bladder; KBRMEAL: bile acid incremental release rate in gall bladder during meal; kel: navtemadlin elimination rate; kem: M1 elimination rate; kin: response formation rate; kout: response elimination rate; M1: navtemadlin acyl glucuronide metabolite; mc: M1 amount in metabolite central compartment; MEALTIME: flag for meal time (0 for non-meal time, 1 for meal time); mg: M1 amount in gallbladder compartment; MWTR: molecular weight ratio between navtemadlin and M1; nc: navtemadlin amount in central compartment; np: navtemadlin amount in peripheral compartment; Q: intercompartmental clearance; SC50: drug concentration producing 50% of Smax; Smax: maximum stimulatory effect; t: time; V2: volume of navtemadlin central compartment; V3: volume of navtemadlin peripheral compartment.
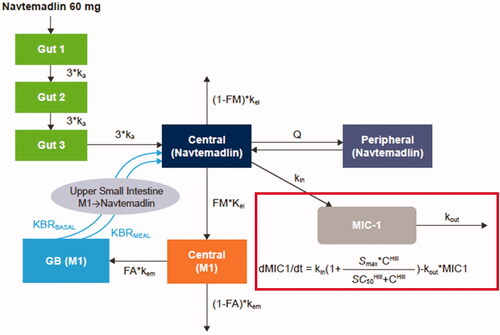
Figure 2. Visual predictive checks for the final PPK model over 0–96 h post dose (A) and 0–24 h post dose (B). Dots: observed. Lines: observed and predicted 5th, 50th, and 95th percentiles. Bands: 95% confidence intervals around predicted 5th, 50th, and 95th percentiles.
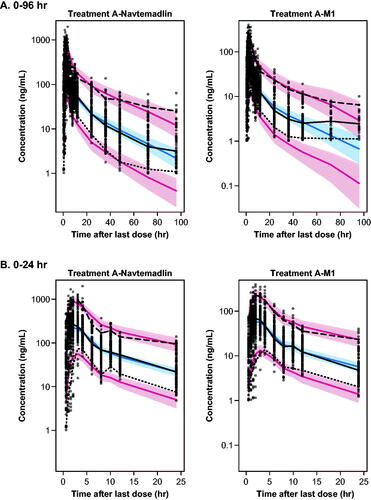
Table 1. Parameter estimates for PPK model.
Figure 3. Visual predictive checks for the final PK/PD model for treatments A, B, and C over 0–96 h post dose. Dots: observed. Lines: observed and predicted 5th, 50th, and 95th percentiles. Bands: 95% confidence intervals around predicted 5th, 50th, and 95th percentiles.
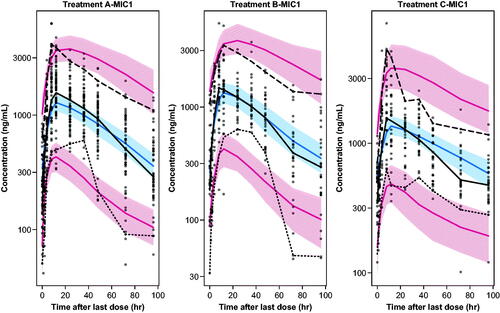
Table 2. Parameter estimates for final PK/PD model.
Figure 4. Simulated amounts of navtemadlin, M1 (left axis), and MIC-1 (right axis) concentration in various compartments and cumulative M1 excreted in bile over time after a single 60-mg dose.
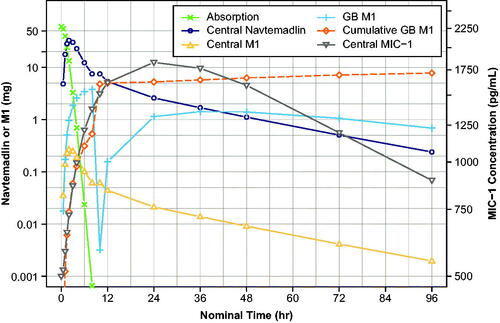
Figure 5. Model-based simulations of steady state navtemadlin PK (upper panels) and glucuronide metabolite M1 PK (lower panels) for 60–480 mg navtemadlin doses given once daily for 7 days over one 28-day cycle in healthy volunteers. Curves are based on the typical healthy volunteer, i.e. the volunteer with the population parameter estimates from the PK model. The top row demonstrates navtemadlin linear scale (left panel) and a semi-log scale (right panel). The bottom row shows M1 linear scale (left panel) and a semi-log scale (right panel). Navtemadlin and M1 concentrations increase with dose. QD: once a day dosing.
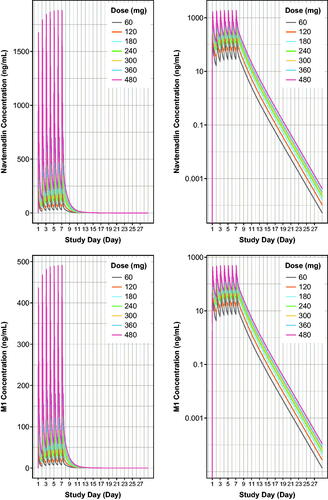
Table 3. Estimated steady state (day 7) navtemadlin and M1 PK parameters (SI units) from model-based population simulations in healthy volunteers.
Figure 6. Model-based simulations of serum MIC-1 excursions for 60–480 mg doses of navtemadlin given once daily for 7 days over one 28-day cycle to healthy volunteers. Curves are based on the typical healthy volunteer, i.e. the volunteer with the population parameter estimates from the PK/PD model with median age, AAG, and CRP. MIC-1 linear scale (left panel) and semi-log scale (right panel). MIC-1 concentrations increase with dose. AAG: alpha-1-acid glycoprotein; CRP: C-reactive protein; QD: once a day dosing.
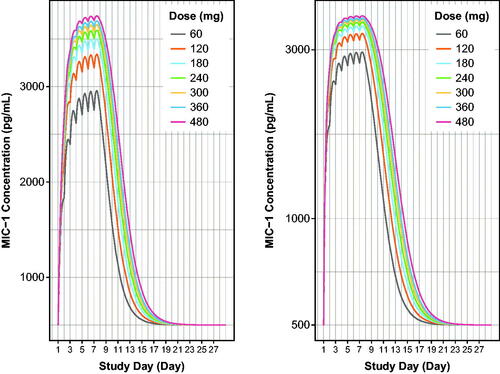
Table 4. Estimated steady state (day 7) serum MIC-1 PD parameters from model-based population simulations in healthy volunteers.
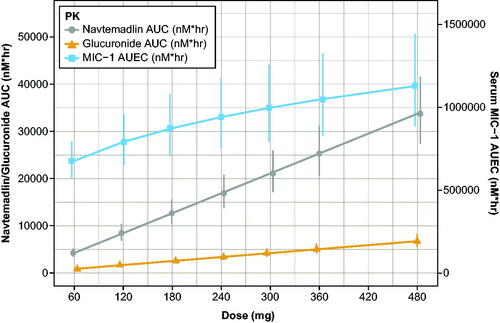
Figure 7. Simulated dose proportionality of molar navtemadlin and M1 AUC and the MIC-1 AUEC. AUC: area-under-the-curve on Day 7; AUEC: area-under-the-effect-curve on Day 7; PK: pharmacokinetics. Values are the mean estimate with 95% confidence intervals using a t-distribution. Conversion factors from ng/mL to nM use navtemadlin molecular weight (MWt) of 568.6 gm/mole: conversion factor ng/mL to nM = 1/MWt × 1000 = 1.758706. Conversion factors from ng/mL to nM use M1 molecular weight (MWt) of 744.7 gm/mole: conversion factor ng/mL to nM = 1/MWt × 1000 = 1.342823. Conversion from pg/mL to nM uses MIC-1 molecular weight (MWt) of 24,600 gm/mole: conversion ng/mL to nM = 1/MWt × 106 = 40.650407.
Supplemental Material
Download PDF (417.1 KB)Data availability statement
The authors confirm that the data supporting the findings of this analysis are available within the article and its supplementary materials.