Figures & data
Figure 1. Correlation between predicted blood CLhep,met scaled from in vitro data using IVIVE Methods 1–3 and the derived in vivo blood CLhep,met for reference compounds (n = 33). Panel A presents the IVIVE of CL from the WSM where all binding parameters are included (IVIVE Method 1); panel B where fuinc is excluded based on the assumption fuinc = 1 (IVIVE Method 2); and panel C where all binding parameters are excluded based on the assumption fub/fuinc cancel out (IVIVE Method 3). The solid line represents line of unity and dotted line represents line of best fit from linear regression. The dot-dashed line represents the liver blood flow limitation set in minipig (38.9 mL/min/kg). Closed and open circles represent reference compounds included or excluded from linear regression analysis and statistical analysis () of the IVIVE of CLhep,met.
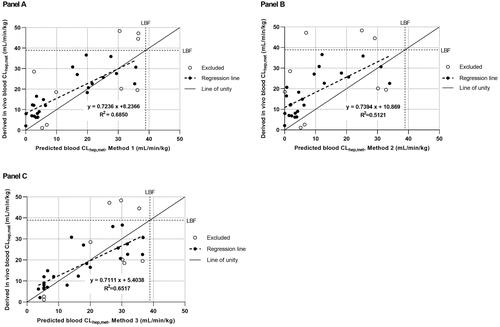
Figure 2. Correlation between log transformed predicted in vivo blood CLint scaled from in vitro data using Methods 4 and 5 and the derived in vivo blood CLint for selected reference compounds (n = 24, listed in ). Panels A–C present the IVIVE of CLint using the WSM with all measured in vitro variables grouped together on the X-axis (Sohlenius-Sternbeck et al. Citation2012); the corresponding regression corrected IVIVE plot of predicted and derived in vivo CLint; the corresponding regression corrected IVIVE plot of predicted and derived in vivo blood CLhep,met respectively (IVIVE Method 4). Panels D–F present the IVIVE of CLint traditionally established with unbound in vitro CLint correlated with in vivo CLint corrected with fub; the corresponding regression corrected IVIVE plot of predicted and derived in vivo CLint,ub; the corresponding regression corrected IVIVE plot of predicted and derived in vivo blood CLhep,met, respectively (IVIVE Method 5).
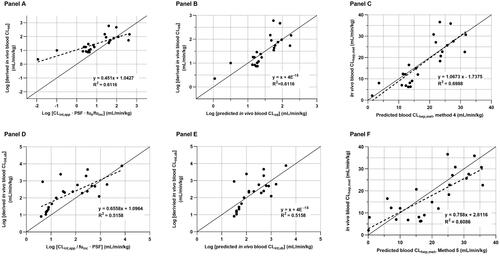
Figure 3. Total plasma and blood concentration-time profiles (mean ± stdev, n = 3) of reference compounds (n = 20) administered by discrete or cassette IV bolus injection to female Göttingen minipigs. *N-des.cloz is an abbreviation for N-desmethylclozapine.
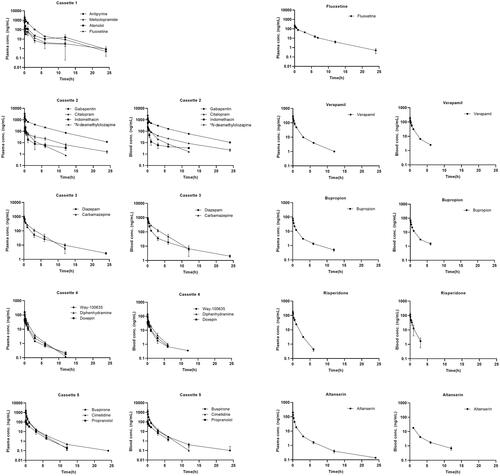
Table 1. In vivo PK parameters determined in female Göttingen minipigs for reference compounds (n = 20).
Table 2. Published minipig in vitro and in vivo IV PK data for reference compounds (n = 19).
Table 3. In silico predictions and in vitro properties determined in Göttingen minipig for the complete reference set (n = 33 compounds).
Figure 4. Comparison of the key parameters used in the WSM for prediction of CLhep,met and in vivo CLint for each reference compound (n = 33). The dynamic range and spread of values measured in vitro (fup, fuinc, CLint,app) and in vivo (plasma CLtotal) are presented in panels A–D, respectively. Closed symbols represent reference compounds recommended for establishing the regression offset.
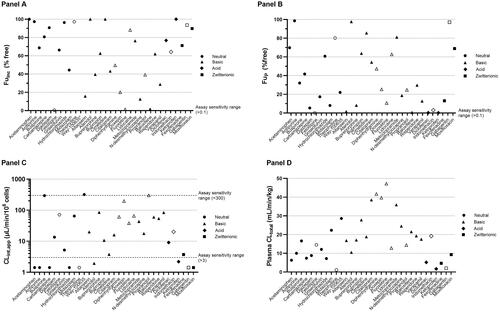
Table 4. Statistical analyses for IVIVE methodologies 1–5 used to predict minipig in vivo blood CLhep,met via the WSM.
Table 5. Statistical analyses for IVIVE methodologies 4–5 used to predict minipig in vivo blood CLint via the WSM.
Figure 5. Prediction of CLhep,met using recommended IVIVE Method 4 (note for method 5 the IVIVE process is established in the same way but using CLint,ub and EquationEquations (14)–(17)). Step 1: the lab-specific ‘regression offset’ is established using the recommended reference set highlighted in Panel 2. Step 2: to assess IVIVE of CLhep.met for a new compound, in vitro data is generated in the same lab-specific assays used in step 1 then scaled using the lab-specific regression offset (slope and intercept) for comparison with the in vivo CLhep,met.
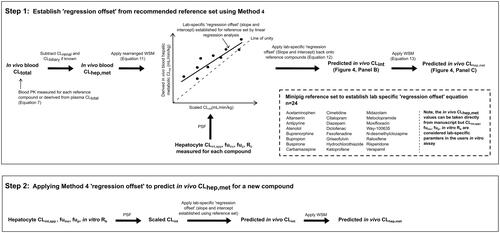
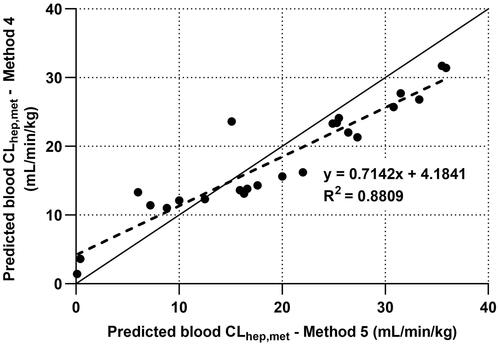
Figure 6. A comparison of the predicted blood CLhep,met from IVIVE Methods 4 and 5 is presented. The solid lines represent line of unity and dotted lines represent line of best fit from linear regression. Closed circles represent recommended reference compounds to establish the empirical regression correction and subsequently used in the statistical analyses () of the IVIVE of predicted in vivo CLint and predicted CLhep,met.