Figures & data
Figure 1. Chemical structures of valsartan, 4-hydroxyvalsartan, eprosartan, losartan, and telmisartan.

Figure 2. Plasma concentrations of the unchanged drugs following intravenous (A) and oral (B) administration of a mixture of valsartan (open circle), eprosartan mesylate (solid square), losartan potassium (open triangle), and telmisartan (solid diamond) in poor metaboliser marmosets. Doses of 0.2 and 2 mg/kg each were administered as free forms by intravenous and oral administration, respectively. Data points are means of three animals and whiskers show SDs.
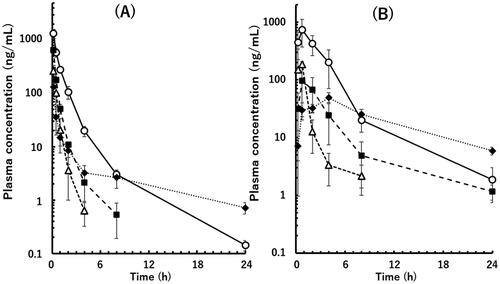
Table 1. Pharmacokinetic parameters following intravenous and oral administration of four angiotensin II type-I receptor blockers to poor metaboliser marmosets.
Figure 3. Relationships between observed human CLt (A), Vss (B), and t1/2 (C) values and those obtained by a single-species allometric scaling method and Wajima superposition for valsartan (circle), eprosartan (square), losartan (triangle), and telmisartan (diamond) using average PK data from poor metaboliser marmosets. The observed human t1/2 value of telmisartan is the mean value obtained from two different reports. The exponent values used in the scaling method are shown in each panel. The solid and dashed lines represent unity and two-fold differences, respectively.
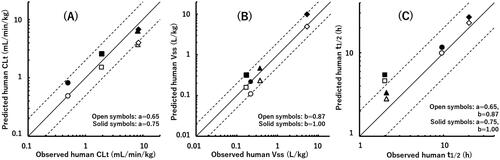
Table 2. Human pharmacokinetic parameters predicted by a single-species allometric scaling method and Wajima superposition from marmoset PK datasets.
Figure 4. Differential HPLC-UV chromatograms of in vitro incubation mixtures of valsartan and isolated hepatocytes from rats (A), dogs (B), a marmoset (C), cynomolgus monkeys (D), and a human donor (E) (chromatograms at 0 h were subtracted from those at 4 h). Synthesised 4-hydroxyvalsartan (a racemic mixture) was analysed under the same HPLC conditions (F). M1, 4-hydroxyvalsartan; M2 and M3, valsartan glucuronides.
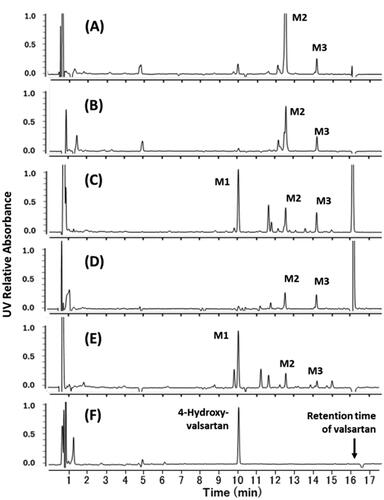
Figure 5. Mass spectrometric characterisation of valsartan (A) and M1 found in the incubation mixtures of valsartan and isolated hepatocytes from a marmoset (B) and a human donor (C). Mass spectra were obtained by scanning the HPLC eluate between retention times of 16.2 and 16.3 min for valsartan (marmoset sample) and 10.0 and 10.2 min for M1 (marmoset and human samples) (see ).
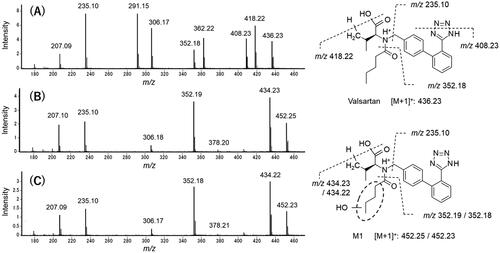
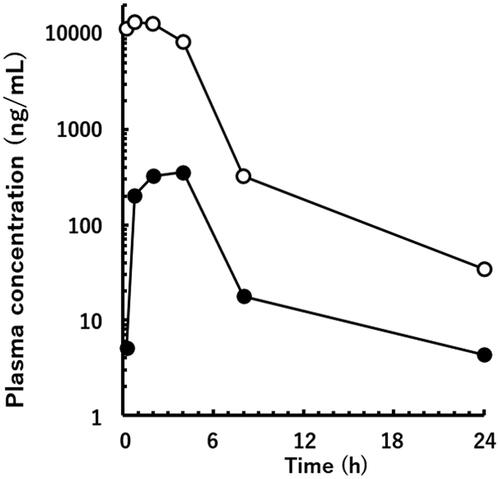
Figure 6. Plasma concentrations of the unchanged drug (open circle) and M1 (solid circle) after oral administration of 30 mg/kg of valsartan in a poor metaboliser marmoset.