Figures & data
Table 1. Summary of metabolites of UNC10201652 detected in microsome and hepatocyte stability assay samples.
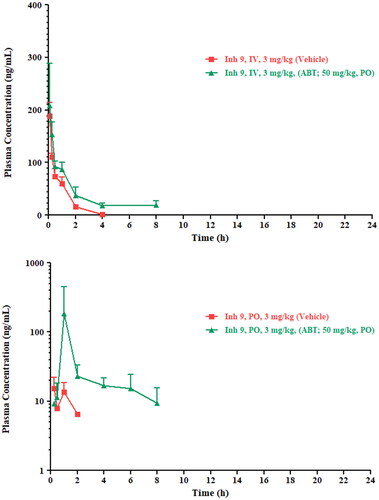
Table 2. Pharmacokinetic parameters for UNC10201652 following IV and PO Administration to mice (3 mg/kg) with and without ABT pre-treatment.
Figure 1. The structure of the specific GUS inhibitor UNC10201652 (4-(8-(piperazin-1-yl)-1,2,3,4-tetrahydro-[1,2,3]triazino[4',5':4,5]thieno[2,3-c]isoquinolin-5-yl)morpholine (Inh 9).
![Figure 1. The structure of the specific GUS inhibitor UNC10201652 (4-(8-(piperazin-1-yl)-1,2,3,4-tetrahydro-[1,2,3]triazino[4',5':4,5]thieno[2,3-c]isoquinolin-5-yl)morpholine (Inh 9).](/cms/asset/81e47ed5-284d-4fcf-b4c4-2b6ca79fc69e/ixen_a_2128468_f0001_b.jpg)
Figure 2. Proposed structures of metabolites of UNC10201652 detected in hepatocyte stability and microsomal stability assay samples. As glucuronidation usually occurs on nucleophilic functional groups these have been shown with Markush structures on the metabolite as possible sites of conjugation. Structure elucidation was not performed on metabolites M7 and M17 as no suitable MSMS data were obtained.
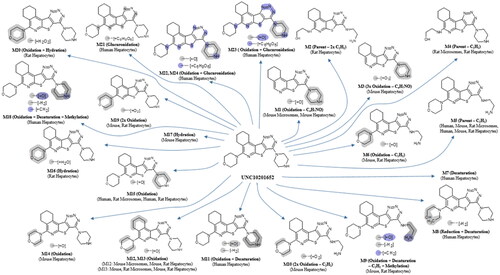
Figure 3. Summed XIC’s of all the metabolites of UNC10201652. Upper: 120 min human hepatocyte samples. Middle: 20 min mouse, and lower: 20 min rat. Metabolites M7 and 18 are not shown in these mass chromatograms. Other peaks are considered to arise from endogenous material.
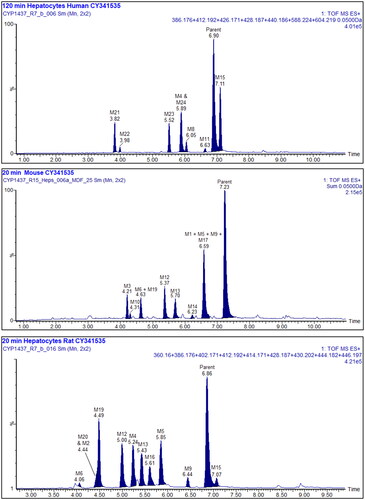
Figure 4. Upper: IV and lower: PO plasma profiles for UNC10201652 following administration at 3 mg/kg in dose vehicle (squares) or following ABT pre-treatment (triangles).