Figures & data
Figure 1. Animal versus human fumic ratios (A) and fuhep ratios (B) for 58 and 55 compounds, respectively, measured by Pharmaron.
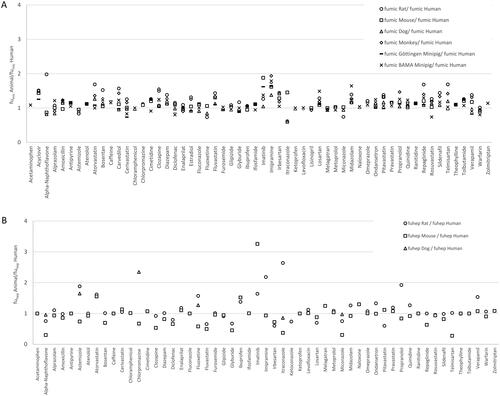
Figure 2. Measured fuhep in rat plotted versus fuhep in humans (A), measured fuhep in mouse versus fuhep in humans (B). The ‘Pharmaron’ data set represents measurements from this study and the ‘Amgen’ data set refers to data reported by Barr et al. (Citation2019). The black line is the line of unity and the dashed lines indicate a 2-fold change.
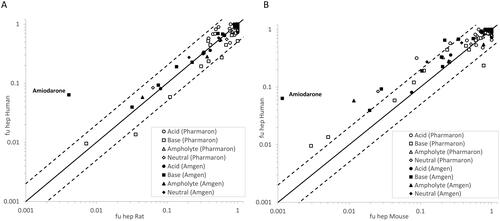
Figure 3. Range of reported values for human microsomal binding for compounds with more than 10 independent measurements reported in the literature. Values were normalised to 1 mg microsomal protein/mL. Compounds 1= Alprazolam, 2= Amitriptyline, 3 = Chlorpromazine, 4 = Clozapine, 5 = Desipramine, 6 = Diclofenac, 7 = Diltiazem, 8 = Imipramine, 9 = Midazolam, 10 = Propranolol, 11 = Quinidine, 12 = Tolbutamide, 13 = Verapamil, 14 = Warfarin. The black diamonds and squares represent the predict fumic value using the Turner-Simcyp model and predicted (diamond) or measured physicochemical data (square), the other coloured circles represent the measured data collated from the literature publications.
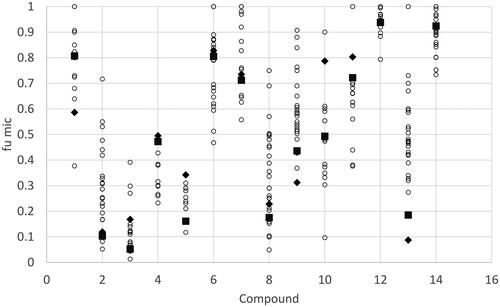
Table 1. Summary of data by compound class after the cleaning and consolidation steps described in the main text and excluding model outliers identified in the main text.
Table 2. Human liver microsomal binding (0.5 mg/ml) and human hepatocyte incubation binding (0.5 × 10⁶ cells/ml) logP and logD data generated using the methods described in the methods section of this paper.
Table 3. Prediction accuracy for the 4 in silico methods to predict the measured fumic values for the Pharmaron compound set.
Table 4. Prediction accuracy for the 4 in silico methods to predict the fumic values for the literature collated dataset.
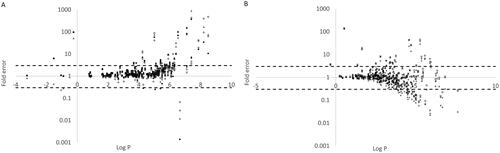
Figure 4. The relationship between logP and prediction error of microsomal binding for (A) acidic and (B) basic compounds. The four methods are represented by Turner-Simcyp (square), Austin (diamond), Hallifax-Houston (triangle), and Poulin (circle; only calculated for acidic compounds as information on plasma fu and BP was missing to make predictions for the basic compounds (see methods section)).