
Figures & data
Figure 1. Chemical structure of BIC.
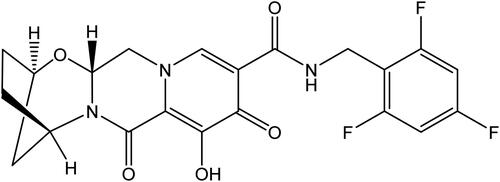
Table 1. In vitro ADME properties of BIC.
Table 2. Summary of metabolites of BIC detected in cryopreserved hepatocytes.
Figure 2. Plasma PK profile of BIC following a single-dose administration in rat, dog, and cynomolgus monkey (n = 3, mean ± S.D.). (A) Intravenous infusion (30 min) at a dose of 0.5 mg/kg; (B) oral solution administration at a dose of 0.5 mg/kg (rat) and 1 mg/kg (dog, monkey). Cyno: cynomolgus monkey.
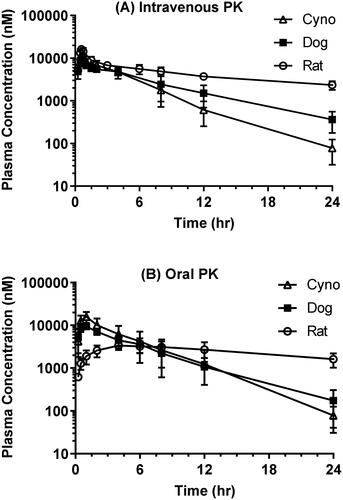
Table 3. Nonclinical plasma PK parameters for BIC following a single-dose administration (n = 3, mean ± S.D.).
Table 4. Comparisons between in vitro predicted clearance and in vivo measured clearance.
Table 5. Correlations between in vitro predicted clearance with plasma and liver microsomal protein binding applied and in vivo measured clearance.
Figure 3. Clinical steady state mean PK profile following repeat dosing of BIC 100 mg once daily for 7 days in healthy subjects. Projected PK (dashed line) and observed PK (solid line) are shown (n = 6, mean ± S.D.).
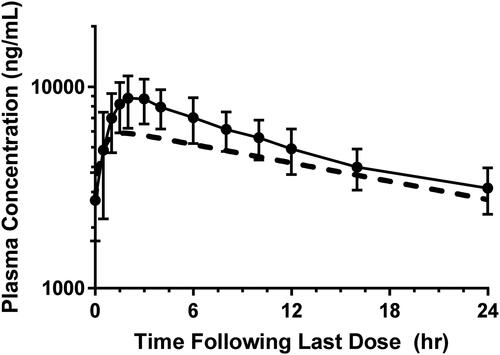
Table 6. Plasma PK summary of BIC following single- and multiple-dose administration of BIC 100 mg in healthy subjects.
Table 7. In vitro PK drug interaction assessment of BIC.