Figures & data
Figure 1. Omeprazole 5-hydroxylation and sulfoxidation activities of recombinant human and dog P450 1 A, 2 C, and 3 A enzymes and dog liver microsomes. Mean activities of omeprazole 5-hydroxylation (gray bars) and sulfoxidation (pink bars) with SD values (whiskers) were determined for recombinant enzymes (A) and liver microsomes (B) using substrate concentrations of 10 µM (light color/open bars) and 100 µM (dark bars) R,S-omeprazole in triplicate reactions.
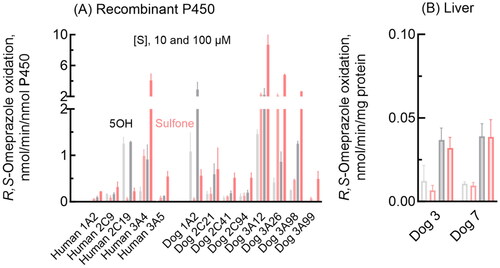
Figure 2. Omeprazole 5-hydroxylation and sulfoxidation activities of recombinant dog P450 1A2, 2C21, and 3A12 enzymes. 5-Hydroxylation (open circles) and sulfoxidation (closed circles) activities of dog P450 1A2 (A-C), 2C21 (D-F), and 3A12 (G-I) towards R-omeprazole (A, D, G), R,S- omeprazole (B, E, H), and S-omeprazole (C, F, I) were determined at substrate concentrations of 2.0–300 µM. Kinetic parameters for omeprazole 5-hydroxylation and sulfoxidation activities were calculated using nonlinear regression (mean ± standard error, n = 10 substrate concentrations, in triplicate) and are shown in .
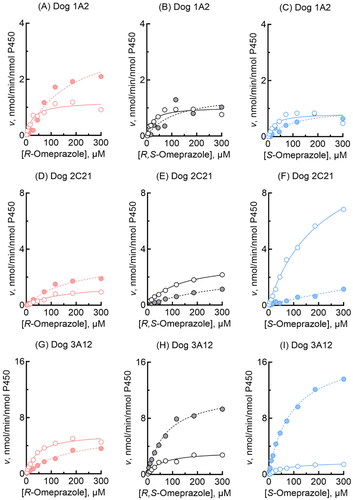
Figure 3. Omeprazole 5-hydroxylation and sulfoxidation activities of liver microsomes from two individual dogs. Activities towards R-omeprazole (A, C) and S-omeprazole (B, D) 5-hydroxylation (open circles) and sulfoxidation (closed circles) in dog liver microsomes were determined at substrate concentrations of 2.0–300 µM. Kinetic parameters for omeprazole 5-hydroxylation and sulfoxidation activities were calculated using nonlinear regression (mean ± standard error, n = 10 substrate concentrations, in triplicate) and are shown in .
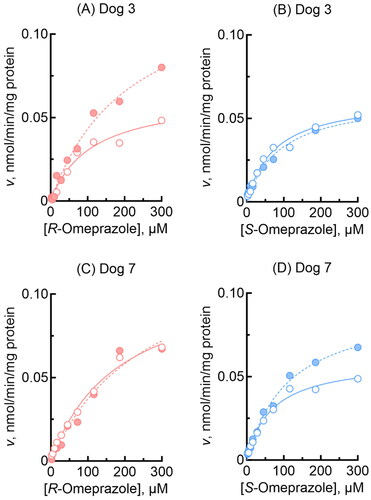
Table 1. Kinetic analysis of omeprazole oxidation by recombinant dog P450 1A2, 2C21, and 3A12 enzymes.
Table 2. Kinetic analysis of omeprazole oxidation by liver microsomes from two individual dogs.
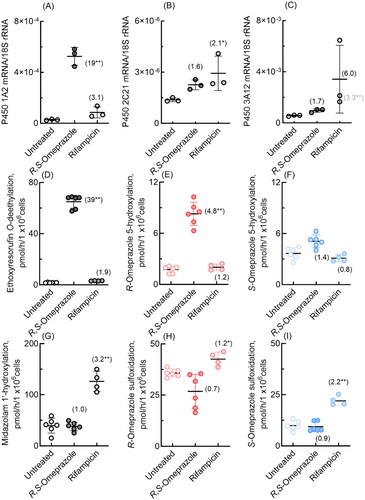
Figure 4. mRNA expression levels of human P450 1A2, 2C9, 2C19, 3A4, and 3A5 (A–C) and drug oxidation activities (D–I) in cultured HepaRG cells treated with R,S-omeprazole or rifampicin. Numbers in parentheses indicate the fold induction relative to the untreated group. In panels B and C, mRNA levels of P450 2C19 and 3A5 are indicated by triangles. Results for drug oxidation activities are expressed as mean values (± SD) obtained from three or four wells of cultured hepatocytes on day 2 (*p < 0.05 and **p < 0.01, one-way analysis of variance with Dunnett’s post tests).
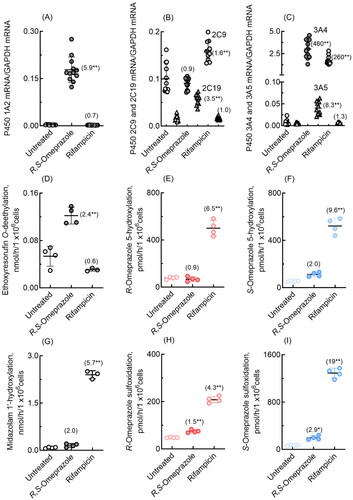
Figure 5. mRNA expression levels of human P450 1A2, 2C9, 2C19, 3A4, and 3A5 (A–C) and drug oxidation activities (D–I) in cultured HepaSH cells treated with R,S-omeprazole or rifampicin. Numbers in parentheses indicate the fold induction relative to the untreated group. In panels B and C, mRNA levels of P450 2C19 and 3A5 are indicated by triangles. Results for drug oxidation activities are expressed as mean values (± SD) obtained from four to six wells of cultured hepatocytes on day 2 (*p < 0.05 and **p < 0.01, one-way analysis of variance with Dunnett’s post tests).
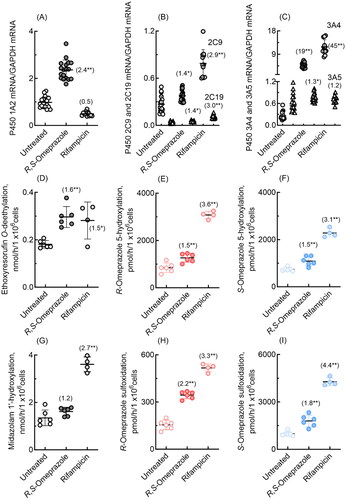
Figure 6. mRNA expression levels of dog P450 1A2, 2C21, and 3A12 (A–C) and drug oxidation activities (D-I) in cultured hepatocytes derived from dog hepatocytes treated with R,S-omeprazole and rifampicin. Numbers in parentheses indicate the fold induction relative to the untreated groups. Results are expressed as mean values (± SD) obtained from three to six wells of cultured hepatocytes on day 2 (*p < 0.05 and **p < 0.01, one-way analysis of variance with Dunnett’s post tests). As shown in panel C, dog P450 3A12 was significantly induced (3.3-fold) even when the largest value, an apparent outlier, was omitted.