
Figures & data
Table 1. Average half-life of DMT after incubation with human liver microsomes in the absence or presence of different enzyme inhibitors.
Figure 1. Combined extracted chromatogram of detected metabolites at different time points after incubation of DMT with CYP2D6.
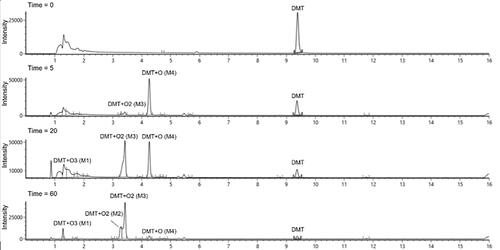
Figure 2. Signal response of DMT and the four major metabolites over time after incubation of DMT with CYP2D6.
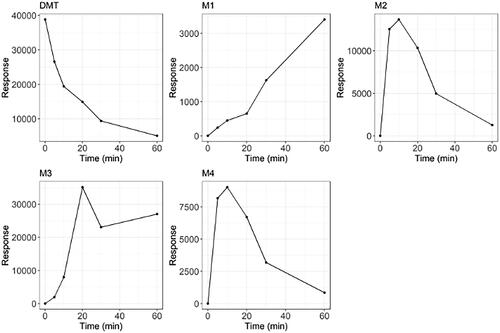
Table 2. Proposed formula, transformation, retention time (RT), mass of molecular ion and mass error (ppm) of DMT and metabolites after incubation with CYP2D6.
Figure 3. Fragmentation patterns of DMT and the identified metabolites at a collision energy of 10 eV.
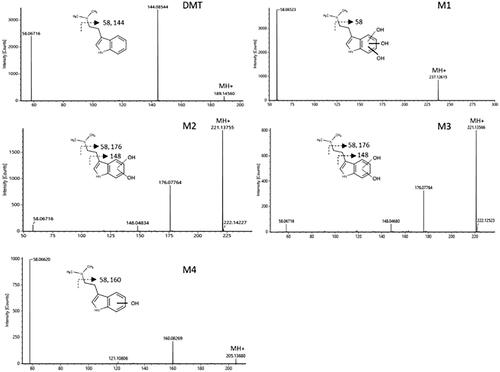
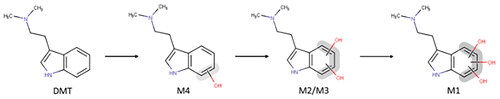
Figure 4. Proposed metabolic pathway of DMT via CYP2D6.
Supplemental material