Figures & data
Figure 1. Map of southern Africa showing the location of Apollo 11, Hollow Rock Shelter and Umhlatuzana. Current rainfall zones (from Chase and Meadows 2007: 104, ) are marked with light grey and white lines. East and north of the white line is the summer rainfall zone. West of the light grey line is the winter rainfall zone. Between the lines is the year-round rainfall zone. The background map is a composite satellite image of South Africa in November 2002 (https://commons.wikimedia.org/w/index.php?title=File:Composite_satellite_image_of_South_Africa_in_November_2002.jpg&oldid=107710174, consulted 12 June 2017).
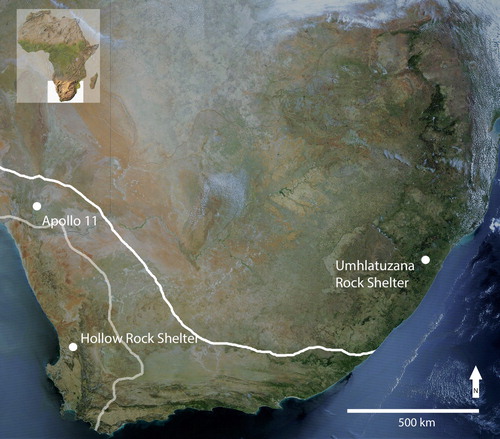
Figure 2. Apollo 11 Rock Shelter (in the middle, bottom third of the image) in the foothills of the Huns Mountains, Namibia. Photograph kindly provided by Ralf Vogelsang.
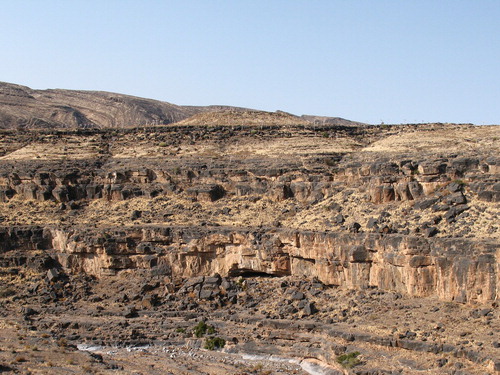
Figure 3. The points, preforms and point fragments from Apollo 11 Rock Shelter included in the present analysis. The pieces are arranged according to completeness or fragmentation as represented in Table 4.
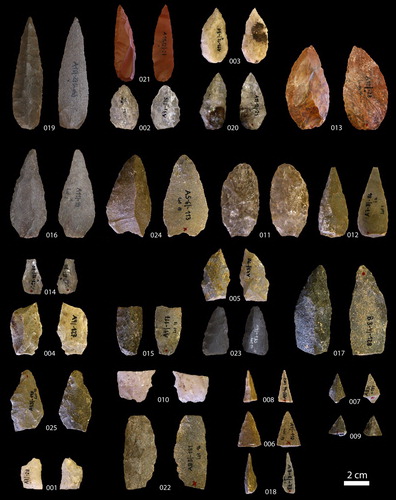
Figure 4. Description of complete points, fragment types and cross-sections as used in the analysis.
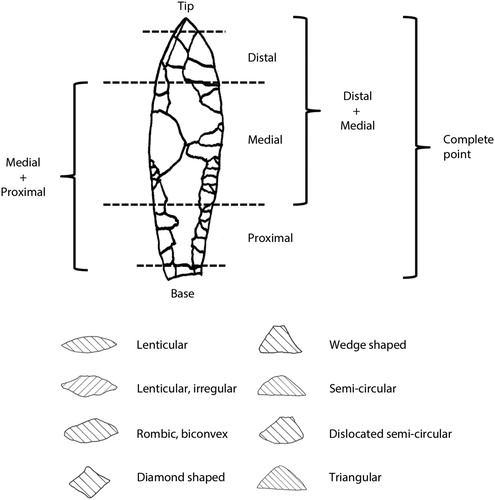
Figure 5. Illustration of the interpretative matrix with identified point-production phases and strategies (slightly modified from Högberg and Lombard 2016a: 10, ).
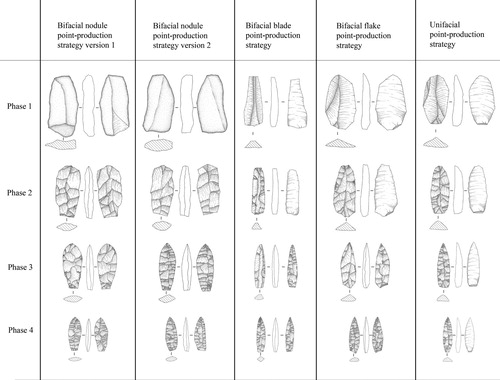
Table 1. Analytical method/procedure: definition of attributes used during the analysis of points from the Apollo 11 Rock Shelter Still Bay context.
Table 2. Definitions for interpreting production phases (modified from Högberg and Lombard Citation2016a: 6, ).
Table 3. Matrix for attributes and definitions in relation to point-production strategies and production phases used in the analysis, described for phase 2, 3 and 4 points (from Högberg and Lombard Citation2016a: 9-10, ).
Table 4. Analytical data from all 25 points from Apollo 11 Rock Shelter (see , and for the definition of attributes).
Figure 6. The relationships between length, width and thickness measurements for the complete and almost complete Apollo 11 pieces (see and Table 4), arranged from thinnest to thickest, with standard deviation bars and trend lines for each dimension.
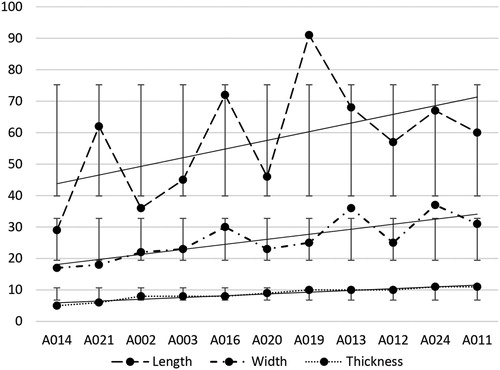
Table 5. Summary of the morphological data of whole and almost whole pieces (N = 11) from Apollo 11 Rock Shelter.
Figure 7. Apollo 11: close-up of negative flake removals from pressure flaking on point number 021.
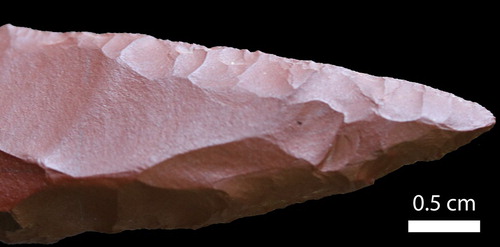
Table 6. Summary of some technological attributes.
Figure 8. Comparative mean morphometric values for Still Bay complete and almost complete point assemblages from Apollo 11 Rock Shelter (N= 11), Hollow Rock Shelter (N = 20; 13 whole points, six whole points with tip or base missing and one point with lateral break [Högberg and Larsson 2011: 137, Table 3]) and Umhlatuzana Rock Shelter (N = 16, including eight serrated points [Lombard et al. 2010]). The data include points from all phases of manufacture.
![Figure 8. Comparative mean morphometric values for Still Bay complete and almost complete point assemblages from Apollo 11 Rock Shelter (N= 11), Hollow Rock Shelter (N = 20; 13 whole points, six whole points with tip or base missing and one point with lateral break [Högberg and Larsson 2011: 137, Table 3]) and Umhlatuzana Rock Shelter (N = 16, including eight serrated points [Lombard et al. 2010]). The data include points from all phases of manufacture.](/cms/asset/7e74453a-afec-4643-87a1-a2d0b06a14ec/raza_a_1513240_f0008_ob.jpg)
Figure 9. Comparative standard deviation values for Still Bay complete and almost complete point assemblages for Apollo 11 Rock Shelter, Hollow Rock Shelter and Umhlatuzana Rock Shelter. The samples are the same as described for .
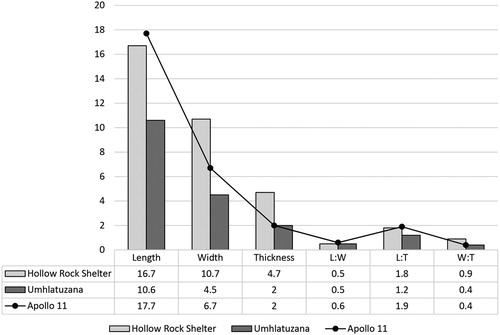
Figure 10. Comparative coefficient of variation (CV) values for Still Bay complete and almost complete point assemblages for Apollo 11 Rock Shelter, Hollow Rock Shelter and Umhlatuzana Rock Shelter. The samples are the same as described for .
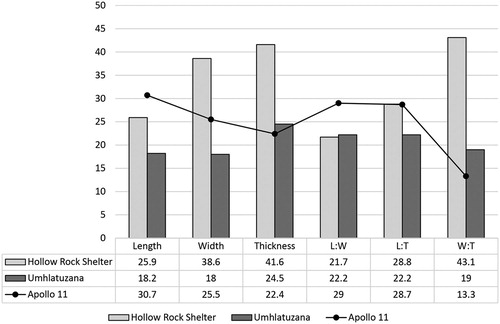
Figure 11. Frequencies in the percentage of cross-section shapes recorded for each assemblage analysed. Note that similar cross-sections, such as lenticular and lenticular-irregular or semi-circular and dislocated semi-circular, have been conflated. Cross-sections of fragments are not always clearly identifiable, thus only pieces with secure cross-section identifications are included here.
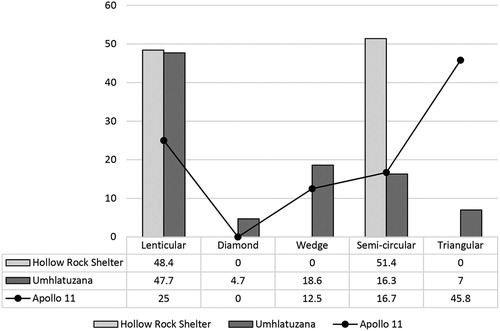
Figure 12. TCSA values for individual phase 3-5 points and point fragments from Apollo 11 Rock Shelter, Hollow Rock Shelter and Umhlatuzana Rock Shelter with logarithmic analysis and forward forecast by two periods for each site.
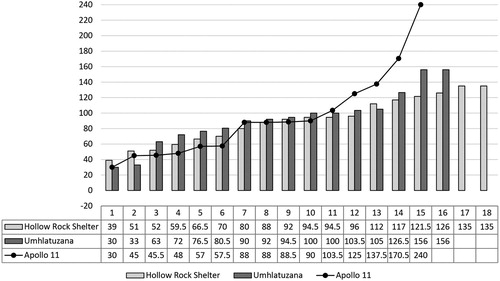
Table 7. All points included in the present analysis from Apollo 11 Rock Shelter, Hollow Rock Shelter and Umhlatuzana Rock Shelter presented in numbers and percentage of the whole assemblage of points for each point-production strategy (top percentage line), as well as in relation to stone type used (bottom percentage line). Note that crystal quartz points from Umhlatuzana Rock Shelter and Apollo 11 Rock Shelter, as well as a point made out of rose quartz from Apollo 11, are all included in the quartz data below. Data on Hollow Rock Shelter and Umhlatuzana Rock Shelter are from Högberg and Lombard (2016a: 16, ).
Figure 13. Frequencies of each point-production strategy in relation to rock type for each site. The diagram is based on the numbers given in Table 7. White: bifacial nodule strategy 1; grey background with white dots: bifacial nodule strategy 2; light grey: bifacial blade strategy; dark grey: bifacial flake strategy; checkered grey and white: unifacial strategy; white background with black dots: not known.
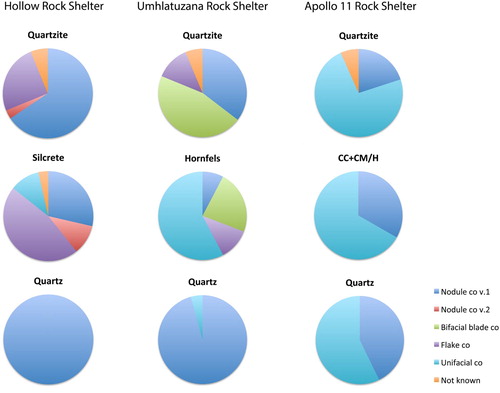
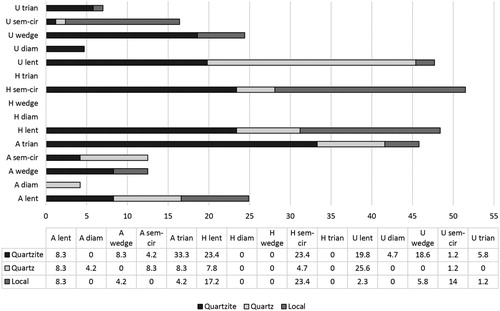
Figure 14. Frequencies of cross-sections represented in each assemblage in relation to raw material. Note that similar cross-sections, such as lenticular and lenticular-irregular or semi-circular and dislocated semi-circular, have been conflated. Cross-sections of fragments are not always clearly identifiable, thus only pieces with secure cross-section identifications are included here. Abbreviations used: A Apollo 11 Rock Shelter; H Hollow Rock Shelter; U Umhlatuzana Rock Shelter; lent lenticular; diam diamond-shaped; sem-cir semi-circular; trian triangular.