Figures & data
Figure 1. Map showing the locations of Napata, Meroe and Hamadab along the River Nile.
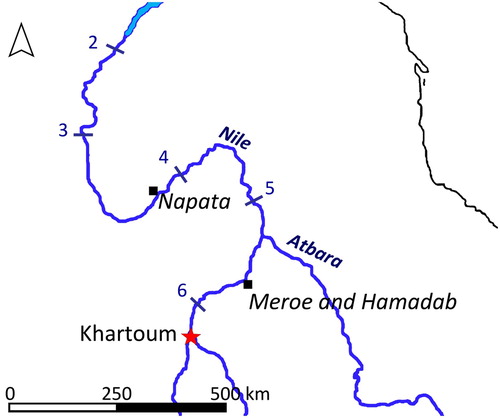
Figure 2. Meroe: view from the northern pyramid cemetery to the southern pyramid cemetery, also situated on ferruginous sandstone.
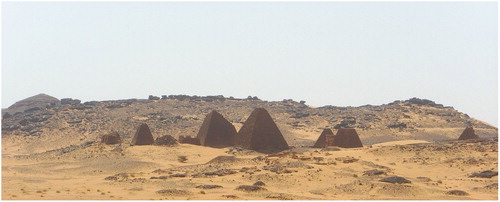
Figure 3. A plateau area to the east of Meroe, with a seasonal wadi bed marked by small outcrops of vegetation.
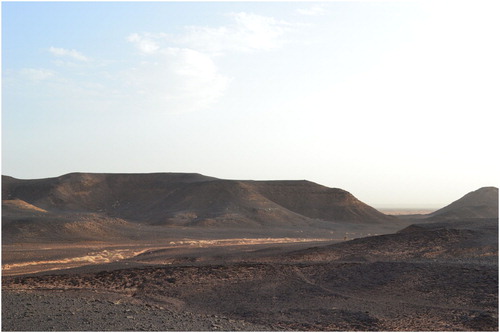
Figure 4. Aerial image of MMA 1. Note the sand-filled depressions pock-marking the plateau (map produced by Frank Stremke).
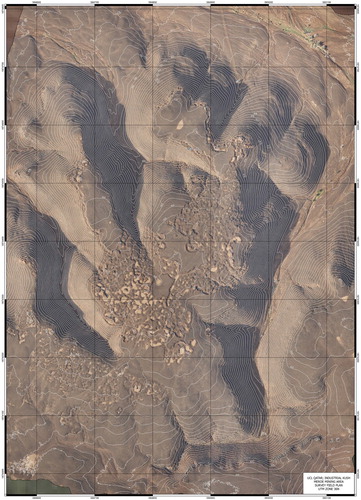
Figure 5. Overview photograph of trench M2-M4-M5, with sediment traps visible in the background and the trench running through sediment traps of differing depths in the foreground.
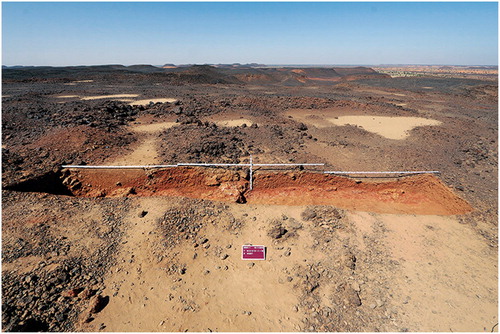
Figure 6. Overview photograph looking south of trench M2-M4-M5 showing the plateau top dotted with sediment traps.
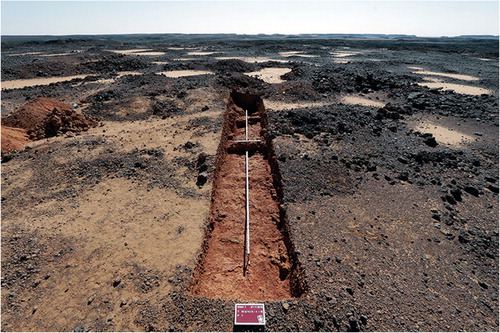
Figure 7. Tool marks found at the southern end of trench M2-M4-M5.
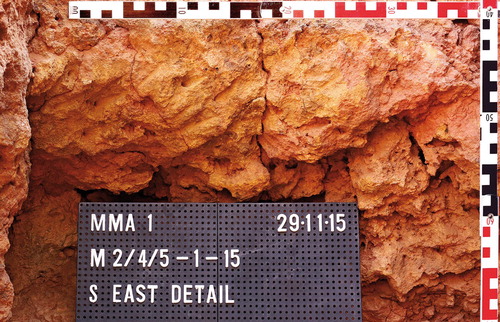
Figure 8. MMA 1: the occurrence of pottery, bricks and iron slag within each of the six grid squares (upper left) and examples of each type of find (iron slag, right; plastered brick, lower left; pottery fragment, lower right).
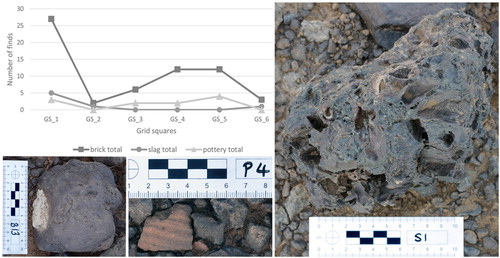
Figure 9. MMA 1: grid survey results showing the distribution of finds (map produced by Frank Stremke).
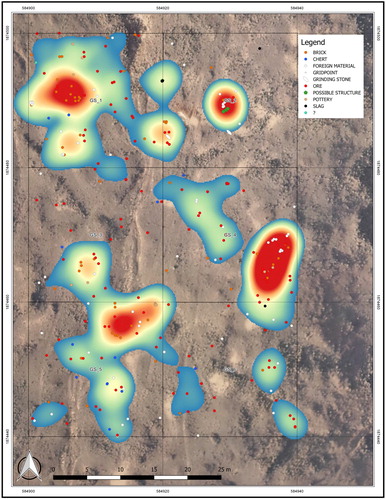
Figure 10. The stone fragment of a statue found at MMA 1. Drawing by Bogumil Pilarski.
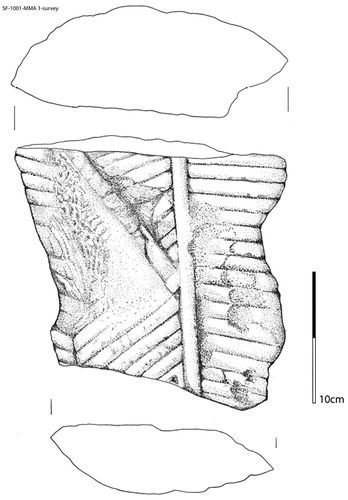
Figure 11. Geological section showing the irregular contact of oolitic ironstone and ferricrete in the principal section of the mining area MMA 1 (image created by Robert Bussert).
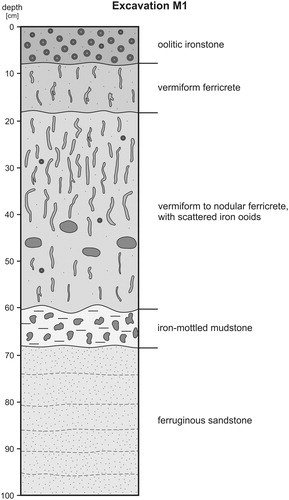
Figure 12. Thin section photomicrograph under plane polarised light of an oolitic ironstone sample from MMA 1 showing spherical, ellipsoidal and partly broken iron ooids in a fine-grained goethitic matrix.
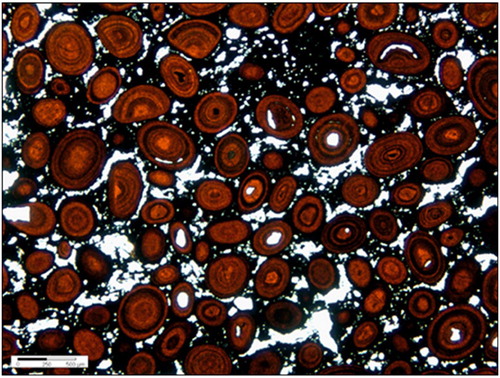
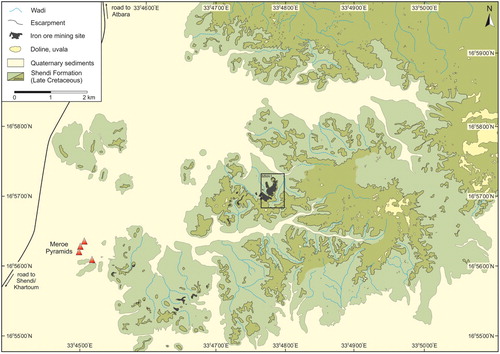
Figure 13. Geological map of the iron ore-mining region to the north east of the Meroe pyramids. The outline of the aerial map in covering the main mining area MMA1 is drawn as a black frame (map produced by Robert Bussert).