Figures & data
Figure 1 Map of the Mitzpe Shalem Early Bronze Age site cluster.
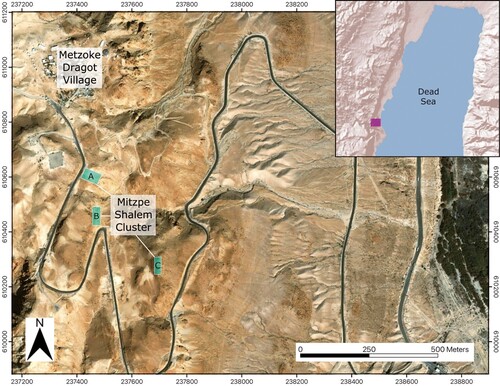
Figure 2 Google earth 3-D view of the environs of the cluster, looking south-west.
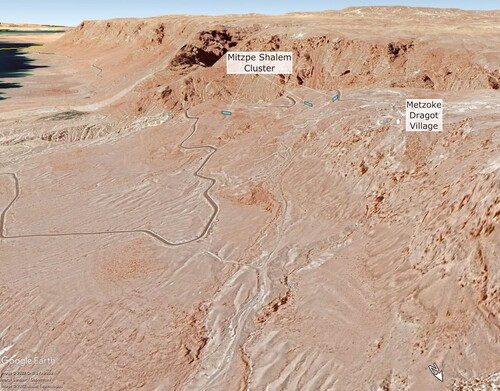
Figure 3 Aerial drone photography of the site cluster. The upper left image shows Site A, looking north. The upper right image shows Site B, looking south. The lower image shows Site A in the foreground, looking south-east towards Site C, while Site B is concealed from Site A, beyond a curve in the hillside.
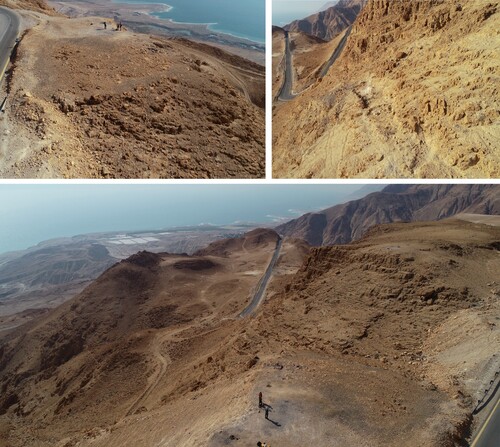
Figure 4 Orthophoto of Site A. The upper image is a superimposition of Bar-Adon’s site plan (Citation1989: fig 2).
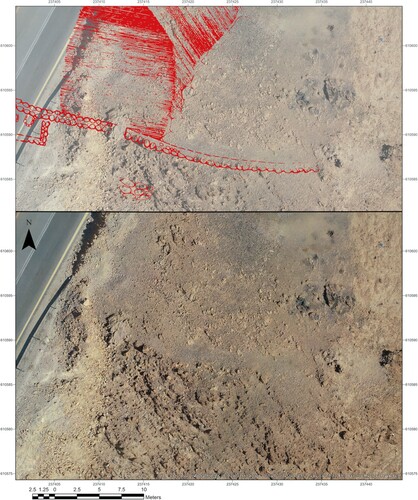
Figure 5 Orthophoto of Site B. The upper image is a superimposition of Bar-Adon’s site plan (Citation1989: fig. 2).
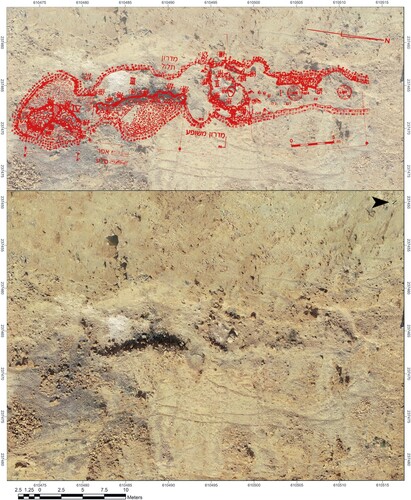
Figure 6 Large and medium storage vessels, and one holemouth cooking pot.
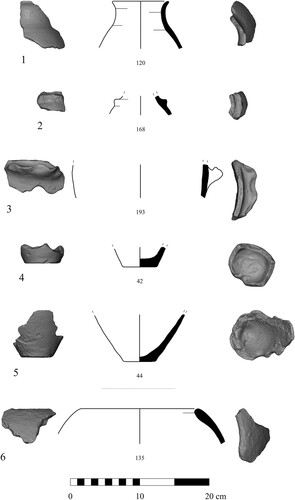
Table 1 Ceramic descriptions and typological parallels
Figure 7 Bowls.
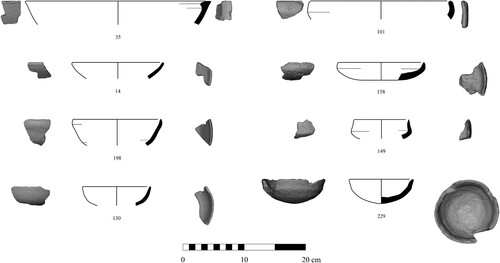
Figure 8 Juglets and miniature vessels.
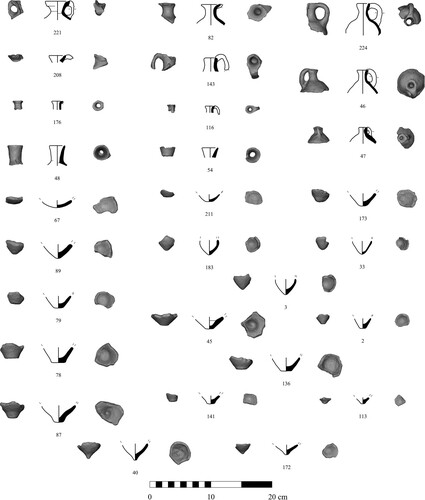
Figure 9 Two complete miniature vessels.
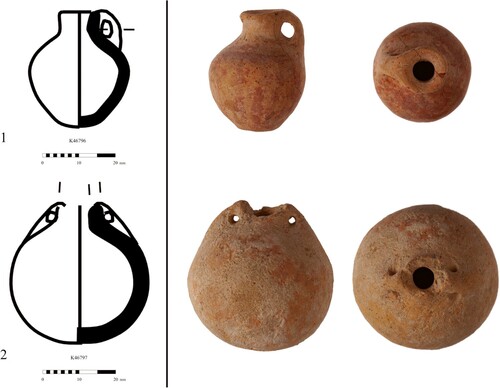
Figure 10 Painted pottery.
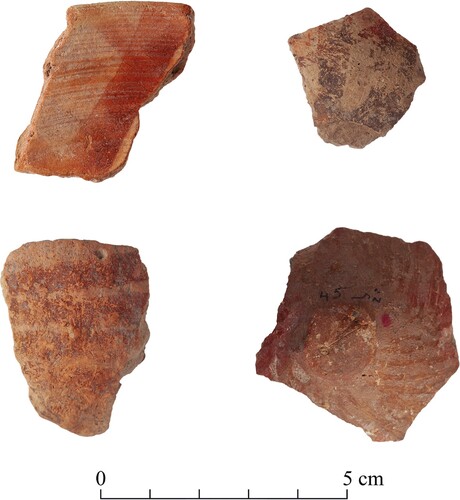
Figure 11 Functional distribution of the ceramic assemblage overall (pie chart) and by area (bar chart).
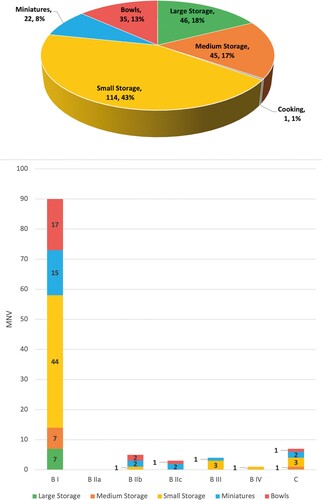
Figure 12 Functional distribution of flint tools, as recorded in Bar-Adon’s unpublished finds lists and illustrated here: overall (pie chart) and by area (bar chart).
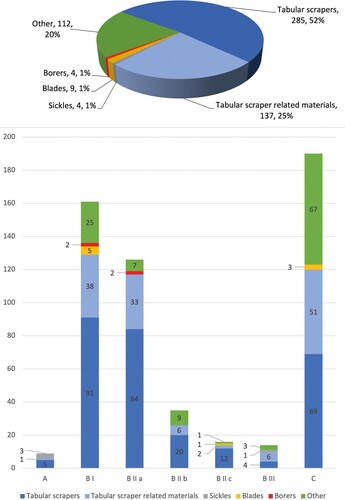
Figure 13 Canaanean blades from Mitzpe Shalem, illustrations from Bar-Adon’s unpublished documentation.
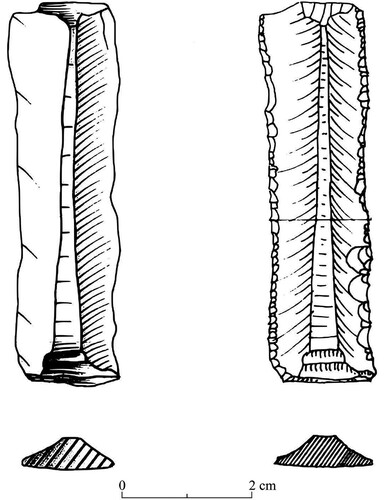
Figure 14 Sample of tabular scrapers from Mitzpe Shalem.
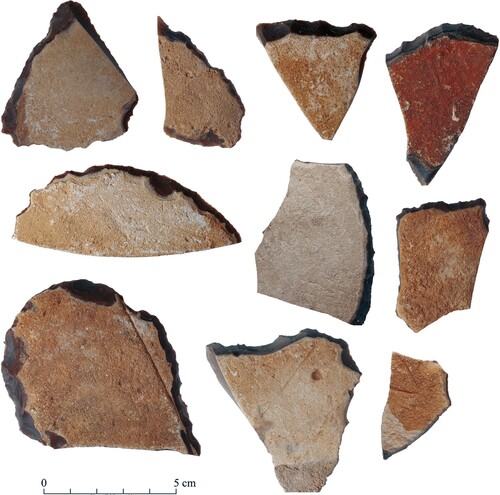
Figure 15 Tabular scraper distribution analysis: (upper image) intra-site distribution of tabular scrapers; (lower image) intra-site distribution of incised tabular scrapers.
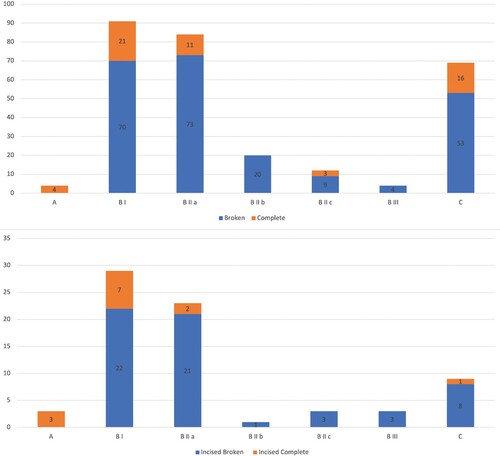
Figure 16 Tabular scraper incisions type distribution analysis: (left pie and bar charts) distribution of tabular scraper incision types in entire assemblage; (right bar chart) intra-site distribution of tabular scraper incision types.
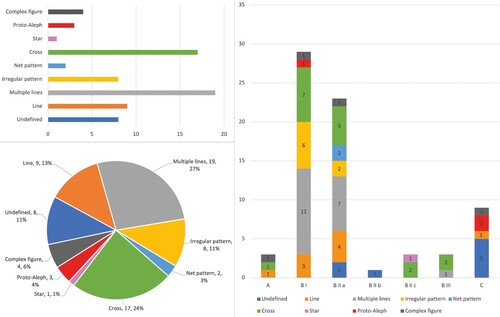
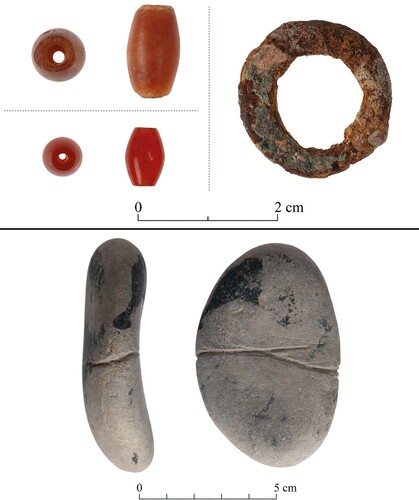
Figure 17 Small finds.