
Figures & data
Figure 1. Descriptive representation of merger gains.
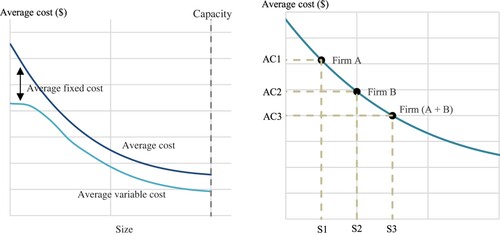
Figure 2. EDBs’ average asset operating costs, scale and density, 2022.
Note: The heat map depicts 2022 annual regulatory filings. The EDB boundaries are taken from https://critchlow.carto.com/tables/networkboundariesplustrees/public.
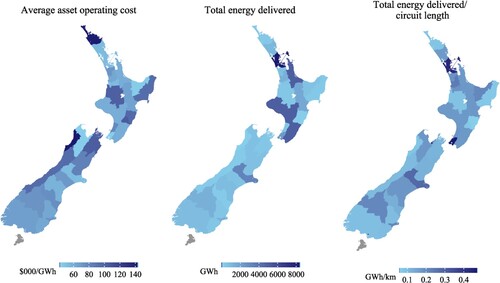
Figure 3. EDBs’ per unit asset operating costs, scale and density of operation, firm-year reporting 2013–2022.
Note: Data sourced from NZ Commerce Commission regulatory filings between 2013 and 2022.
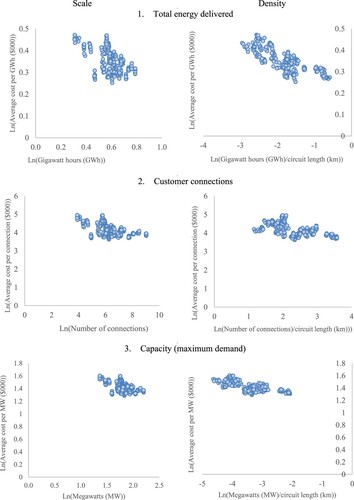
Table 1. Determinants of average operating costs for EDB’s.