Figures & data
Table 1. Responses to Daryl Morey’s tweet about Hong Kong.
Figure 1. Number of Messages in Each Category. Note: Predicted share of messages through time for all accounts by category, binned hourly. 95% confidence intervals are included but too narrow to see on this scale.
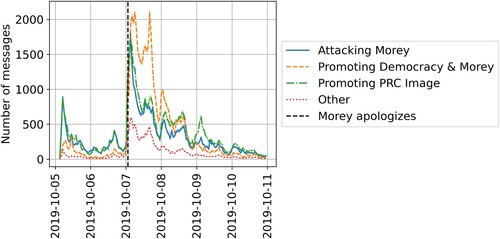
Figure 2. Change in Message Category Share Before and After Apology. Note: Predicted share of messages by category before and after Morey’s apology. The shares are estimated by first averaging the message share to the account level before and after the apology and then averaging over accounts. Error bars represent the 95% confidence interval in the estimated shares.
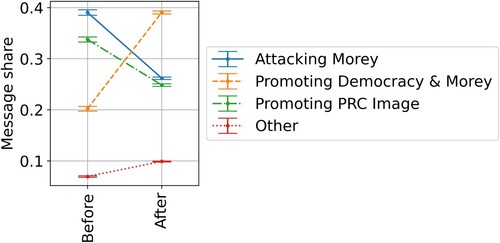
Figure 3. Message Shares by Category Over Time by Troll Status. Note: Predicted message shares through time for trolls and non-trolls, binned hourly and by account type (troll vs. non-troll). Bands represent the 95% confidence interval in the estimated shares.
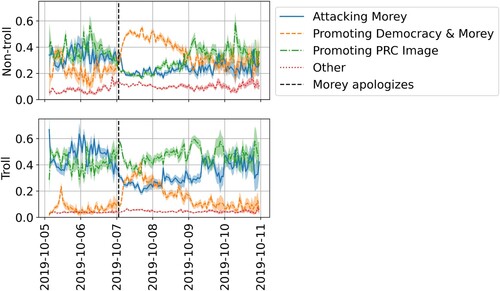
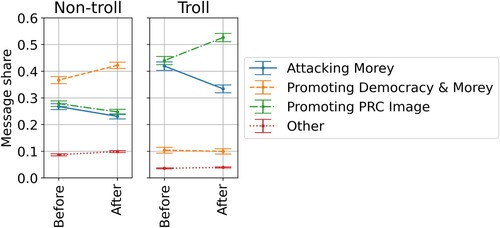
Figure 4. Change in Message Category Share Before and After Apology by Troll Status. Note: Message shares for non-trolls and trolls that were active before and after Morey’s apology. Error bars represent the 95% confidence interval in the estimated shares.