Figures & data
Table 1. The characteristics of included studies.
Table 2. Characteristics of the sixteen trials selected showing general intervention information.
Figure 1. Flow chart showing study identification, inclusion and exclusion.
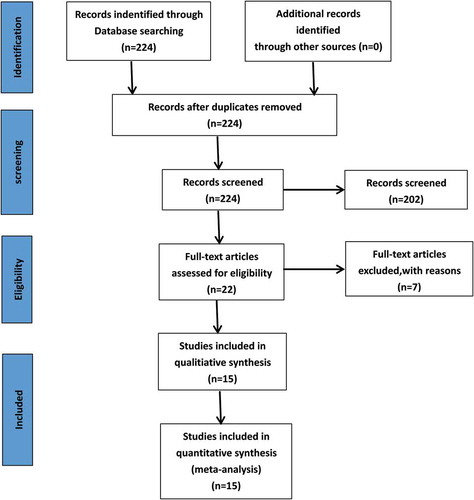
Figure 2. Risk of bias summary.
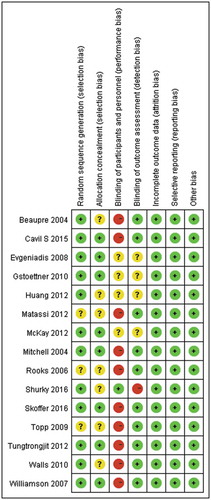
Figure 6. Forest plot of 6-minute walk when compared prehabilitation exercise group with control group.
Figure 8. Forest plot of knee extension when compared prehabilitation exercise group with control group.
Figure 9. Forest plot of knee flexion when compared prehabilitation exercise group with control group.