
Figures & data
Table 1. The study’s sample characteristics.
Table 2. Mean and SD of all study variables.
Figure 1. Differences between participants with and without CSA in relationship satisfaction. Participants with CSA reported significantly lower relationship satisfaction than participants without CSA.
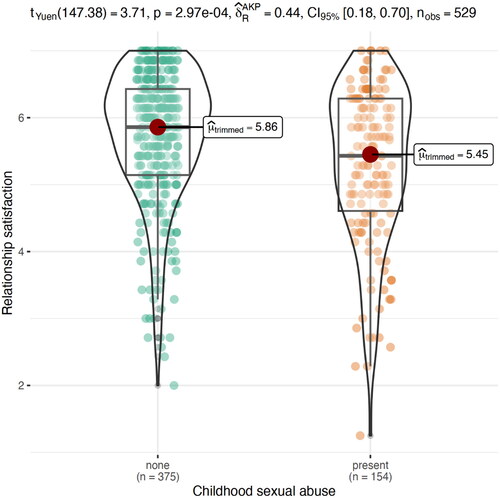
Figure 2. Differences between participants with and without CSA in PTSD (A) and sexual-related PTSS (B). Participants with CSA reported significantly higher severity of PTSD and sexual-related PTSS than participants without CSA.
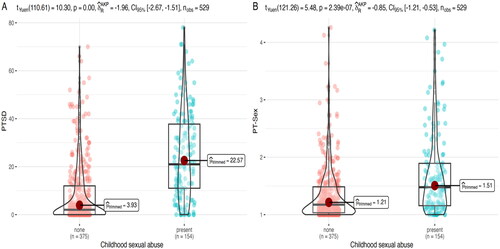
Figure 3. Sexual-related PTSS significantly moderated the association between CSA and relationship satisfaction. Simple slopes test indicated that relationship satisfaction was high among those with low severity of sexual-related PTSS regardless of the presence or absence of CSA. Conversely, among those with high severity of sexual-related PTSS, those with CSA had significantly lower relationship satisfaction as compared with those without CSA.
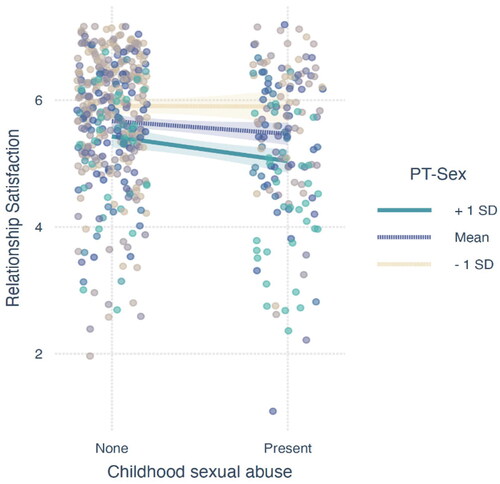
Table 3. Robust regression coefficients for predicting relationship satisfaction by covariates, PTSD, CSA, and their interaction.
Table 4. Robust regression coefficients for predicting relationship satisfaction by covariates, sexual-related PTSS, CSA, and their interaction.
Table 5. Robust regression coefficients for predicting PTSD, sexual-related PTSS, and relationship satisfaction by abuse characteristics.