
Figures & data
Figure 1. EGA results of the initial and final 19-item version of the TASEF.
Note: Red – gratification; blue – fear; green – threat; orange – aversion.
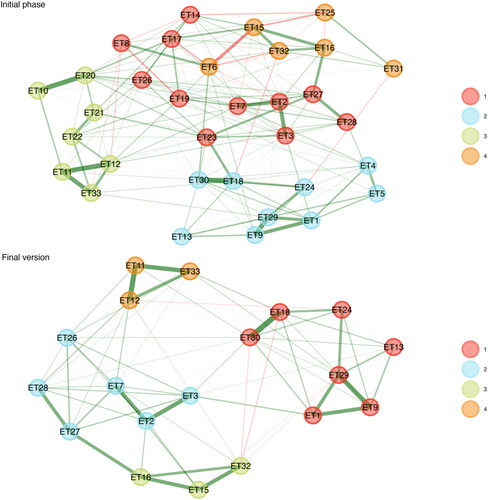
Figure 2. Item stability of the 19-item TASEF. Stability below 75% is poor.
Note: Red – gratification; blue – fear; green – threat; orange – aversion.
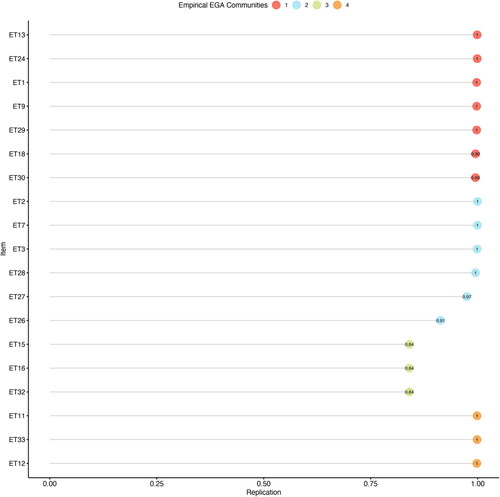
Figure 3. The final CFA of the 19-item TASEF.
Note: Ft1 – gratification; Ft2 – aversion; Ft3 – fear; Ft4 – threat.
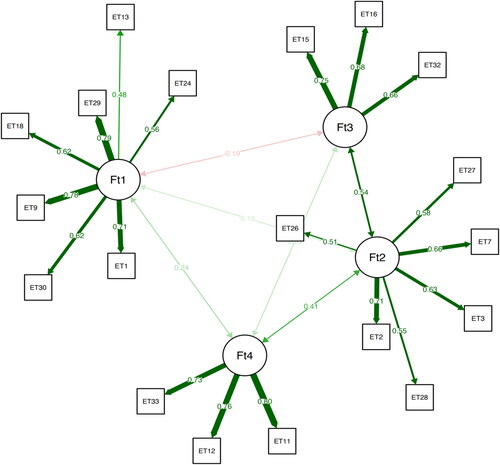
Table 1. Network loadings of the 19-item TASEF (Study 1)
Figure 4. Factor-level Multi-trait Multimethod approach for convergence and discriminant validity.
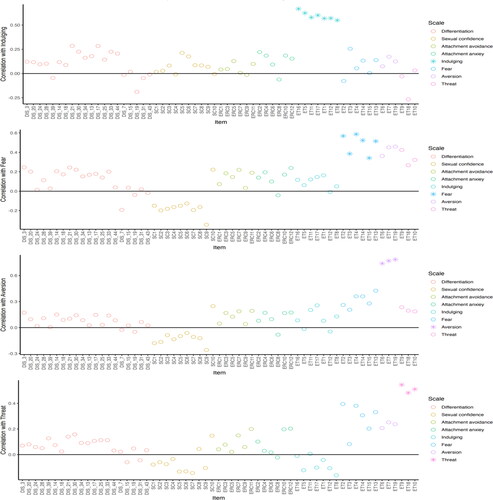
Figure 5. Item-level Multi-trait Multimethod approach for convergence and discriminant validity.
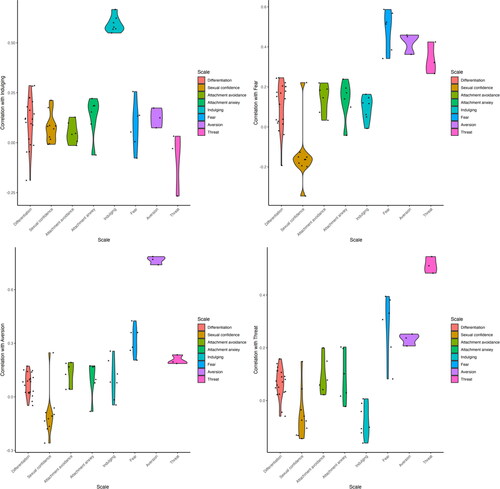
Table 2. Within-factor correlation, convergence, and discriminant scores of erotic transference clusters.
Table 3. Means, standard deviations, statistics, and effect sizes for the differences in erotic transference by gender, family status, sexual orientation, sex therapist, and religiosity.
Table 4. Correlations between TASEF clusters and background measures.
Data sharing statement
The data and materials used in the research can be available upon request.