Figures & data
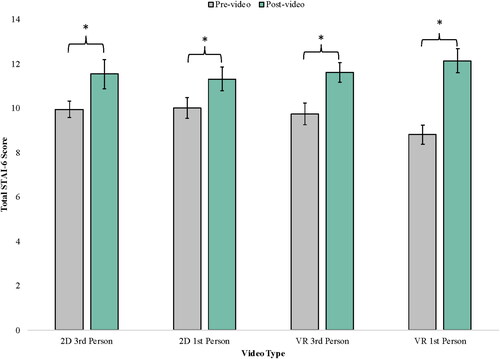
Figure 1. Women’s self-reported pre- and post-video total STAI-6 scores are shown for each video type. Error bars represent standard errors of the mean. Scale ranges from 6–24. *p < 05. A bar graph showing women’s self-reported pre- and post-video total STAI-6 scores for the 2D 3rd person, 2D 1st person, VR 3rd person, and VR 1st person videos. Significant increases in STAI-6 scores for each video, with the largest pre- to post-video increase for the VR 3rd person film.