Figures & data
Figure 1. The Sibaritide in Northern Calabria (Italy). The Raganello Basin is indicated with a grey outline. The four landscape classes used in site classification are marked with dotted lines. Towns (black dots), archaeological sites (grey dots), and case study areas (bold italic font) mentioned in the text are indicated.
Figure 2. Classification scheme for 130 Metal Age surface scatters recorded by the RAP fieldwalking survey in the Raganello Basin, 2000–2010. In parentheses: the number of sites in each class. Shaded categories were not investigated by the authors.
Figure 3. Metal Age site classes in the Contrada Damale and Portieri areas. RAP survey areas are indicated in light grey, RLPI resurvey areas in dark grey. Sites mentioned in the text are labeled.
Figure 4. Examples of datable Metal Age pottery from the Raganello Basin. Top: Dolio a cordoni o fasce fragments from sites RB095a, RB219, and RB228; Bottom: impasto fragments from site RB216.
Table 1. Effects of repeated intensive resurvey of the Contrada Damale foothill area showing increasing site densities and assemblage richness.
Figure 5. Site RB219 at Portieri: the conjunction of Metal Age surface scatters (labeled) and magnetic gradiometry data. All possible combinations of rectangular anomalies and surface scatters are present. Test pit locations are marked in red.
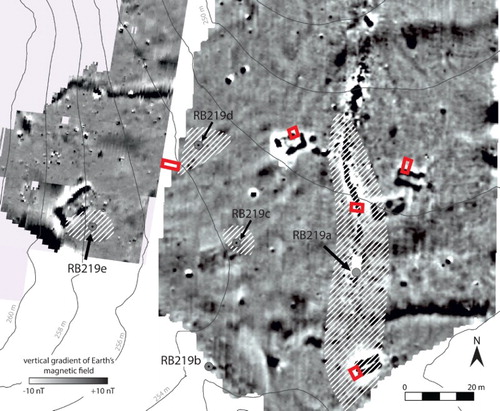
Figure 6. Schematic representation of site formation, exposure and detection at site RB231. 1) LBA building on gentle slope; 2) the building is destroyed by fire; 3) the remains of the burnt structure are covered by colluvium; 4) modern plowing exposes the downslope part of the structure and the refuse heap; 5) geophysical and archaeological detection of the remains. (Drawings W. de Neef).
Figure 7. Monte San Nicola: contour lines at 2 m. Left: locations of RAP sites (numbered dots) and survey units (grey). The approximate area of the site as mentioned in Peroni and Trucco (Citation1994) is indicated with a dashed line; Right: Magnetic gradiometry results. The two areas of increased surface material density are outlined in white.
Figure 8. Monte San Nicola. Surface distribution of impasto fragments in two 30 × 30 m areas, with part of the magnetic gradiometry data produced by Eastern Atlas. Dense pottery scatter RB216, diffuse scatter RB233, and magnetic anomaly RB245a are labeled. Black circles indicate magnetic anomalies mentioned in the text.
Figure 9. Soil erosion (mud flow) after heavy rainfall in the Maddalena catchment in November 2013. Site RB073 is located downslope of the rectangular transformer building in the middle distance. (Photo W. de Neef).
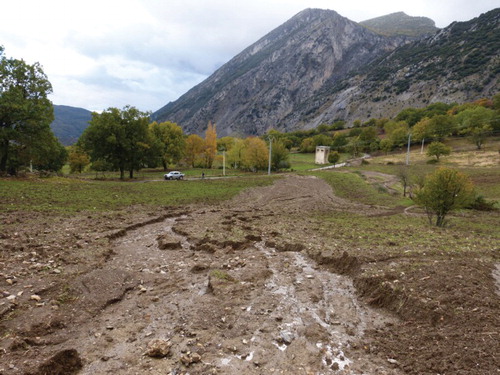
Figure 10. North section of a test pit placed 40 m north of site RB073. The deep, tilted archaeological stratigraphy outcropping a few meters to the right of this pit did not result in a RAP surface scatter.
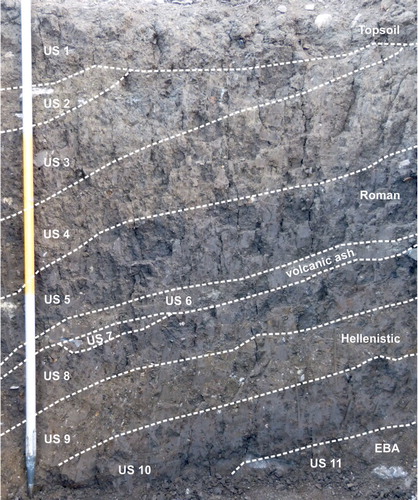
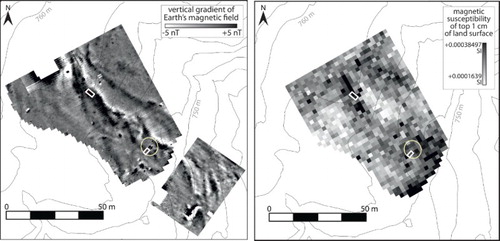
Figure 11. Geophysical data for site RB073 and surroundings, produced by K. Armstrong (2012). Left: Magnetic gradiometry results; Right: surface MS readings. The extent of the surface scatter is indicated by a circle; the two test pits are outlined in white.