Figures & data
Figure 1. Xiongnu habitation sites (white markers indicate permanent settlements; black markers indicate ephemeral habitation findings): 1) Kherlen-Bars; 2) Gua Dov; 3) Gün-Galuu; 4) Bürkh; 5) Terelj; 6) Zaan-khoshuu; 7) Kholtostyn-Khürem (Egiin Gol); 8) Bayan-Under; 9) Boroo; 10) Dureny; 11) Nijnii-Mangirtui; 12) Ivolga; 13) Khanui Gol; and 14) Baga Gazaryn Chuluu.
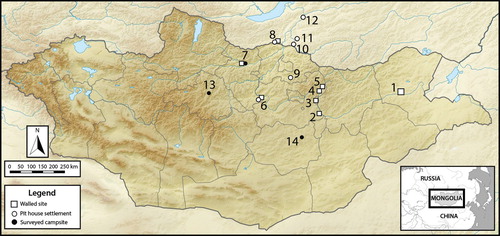
Figure 2. Kherlen-Bars area map showing the locations of four sites: KHB-1 (Khitan); KHB-2 (Xiongnu); KHB-3 (Mongol); KHB-4 (indeterminate).
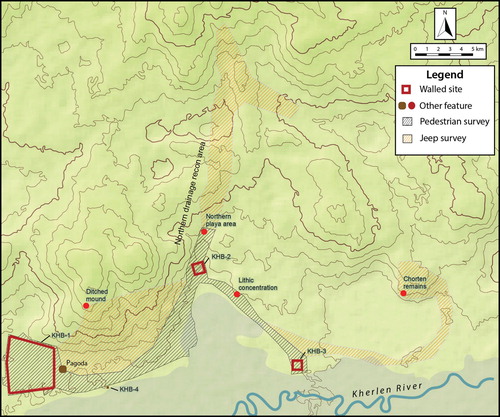
Figure 3. KHB-2 sketch map showing the location of Perlee excavations (in gray dark). Features shown include: 1) the enclosure wall; 2) the East mound; 3) the West mound; and 4) the Small west mound. Redrawn from Perlee (Citation2012 [Citation1957]: 178).
![Figure 3. KHB-2 sketch map showing the location of Perlee excavations (in gray dark). Features shown include: 1) the enclosure wall; 2) the East mound; 3) the West mound; and 4) the Small west mound. Redrawn from Perlee (Citation2012 [Citation1957]: 178).](/cms/asset/56e35a1c-dde0-4f68-89f0-103c9c3958e0/yjfa_a_1598170_f0003_ob.jpg)
Figure 4. KHB-2 West mound north-south cross section. Redrawn from Perlee (Citation2012 [Citation1957]: 180).
![Figure 4. KHB-2 West mound north-south cross section. Redrawn from Perlee (Citation2012 [Citation1957]: 180).](/cms/asset/edf094dc-de94-4936-8030-b68057f05872/yjfa_a_1598170_f0004_oc.jpg)
Figure 5. Xiongnu grey-ware sherd with white temper and scrape-polish decoration, from southwest exterior surface collection unit.
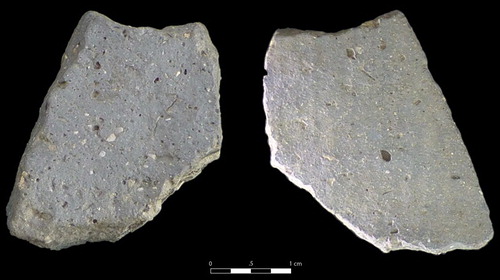
Table 1. Historical era findings of surface survey.
Figure 6. A) The KHB-2 magnetics prospection map and B) details from that map including: 1) the enclosure wall; 2) the East mound; 3) the West mound; 4) the Small west mound; 5) the Northwest platform (KHB-201); 6–7) Northeast structures; 8–10) round pits (including KHB-202); and 11–23) shallow trenches (including KHB-203).
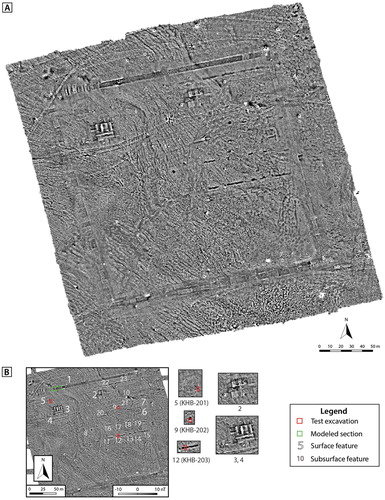
Figure 7. Comparative rectangular structures: A) Northwest house at Bayan-Under (Danilov Citation2011); B) House 9 and pit-houses 10 and 15 at Ivolga (Davydova Citation1995: fig. 24); C) small structures beneath feature 4 at KHB-2; and D) large structures 6 and 7 at KHB-2.
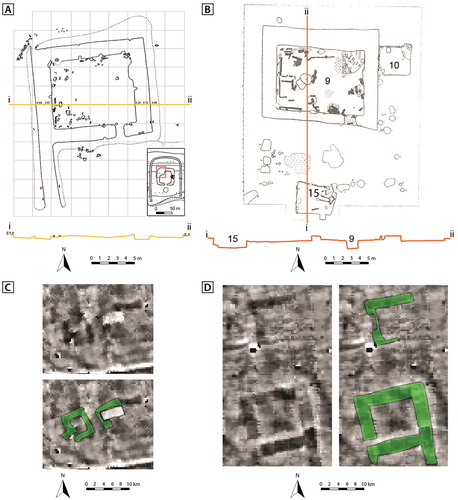
Figure 8. A) KHB-2 Digital Elevation Model showing: 1) the enclosure wall; 2) the East mound; 3) the West mound; 4) the Small west mound; 5) the Northwest platform; 6–7) Northeast structures; 24–25) the low wall; 26) the Central low mound; and 27–32) Southern low mounds. B) A subset of the northeastern corner of the KHB-3 DEM highlighting the low features.
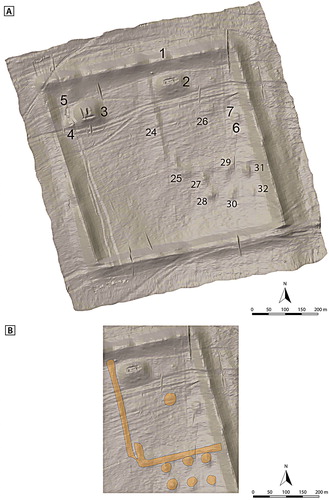
Figure 9. KHB-201 test pit profile section.
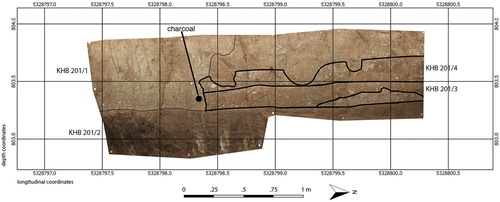
Table 2. Radiocarbon dates calibrated using OxCal v4.2.3 Bronk Ramsey and Lee (Citation2013) and IntCal13 atmospheric curve (Reimer et al. Citation2013).
Figure 10. KHB-202 test pit profile section.
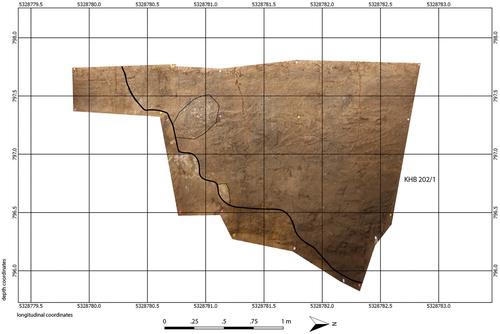
Figure 11. KHB-203 test pit profile section.
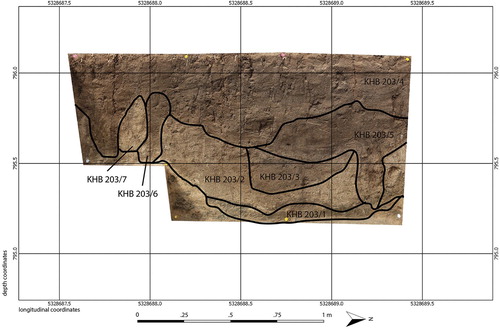
Figure 12. Comparison of measured and modeled magnetic anomalies. A) Shows the measured anomaly due to the ditch, with polygonal cross section shown in red; and B) shows how this measurement approximates the excavation results.
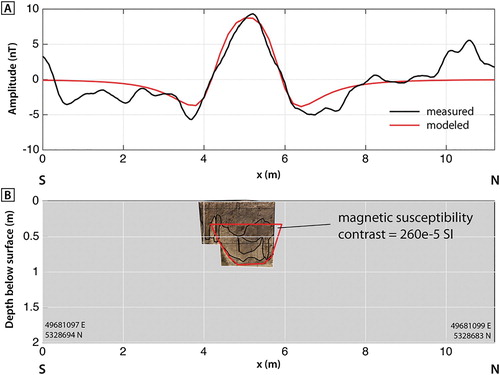
Table 3. Settings used for magnetic modeling.
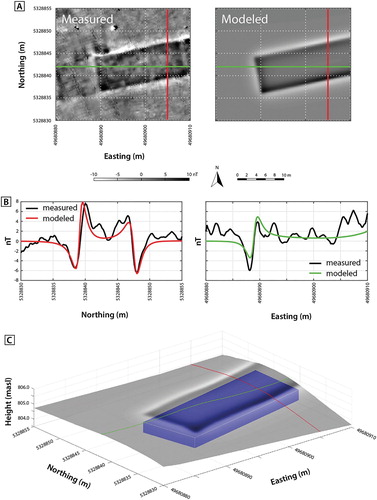
Figure 13. Comparison of measured and modelled magnetic anomalies. A) Shows the location of the cross-sections of the anomalies (the red and green lines), and B shows how the modeled data compares to the measured data for each. C) Shows a 3D model of the prism with the modeled magnetic anomaly on the topography.