
Figures & data
Figure 1. Location of sites in Sudan and Egypt mentioned in the text (EDAR sites marked with a star). 1—Khashm el Girba; 2—Khor Abu Anga; 3—Al-Jamrab; 4—Khor Shambat; 5—Hayna and Tagrada; 6—Sai Island 8-B-11; 7—Gebel Karaiweb; 8—Wadi Halfa; 9—Arkin 8; 10—Bir Sahara; 11—Bir Tarfawi; 12—Kharga Oasis; 13—Dakhla Oasis.
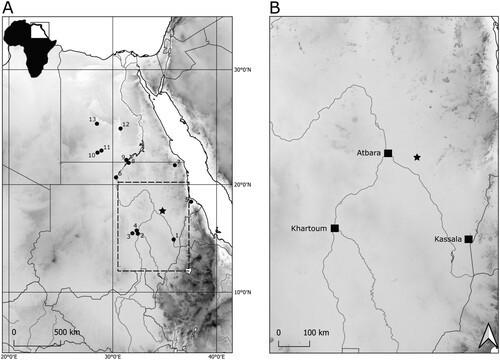
Figure 2. EDAR 135 site. A) Aerial photography of mining shaft complex; EDAR 135 marked with black arrow; B) aerial photography of the EDAR 135 site; C) eastern profile of mining shaft with marked (red dots) places of OSL S4 and S5 (below) sampling places; D) northern profile; E) northern profile before upper level excavations (MSA); F) removing sterile sediments above the lower horizon; and, G) excavating lower horizon (Acheulean).
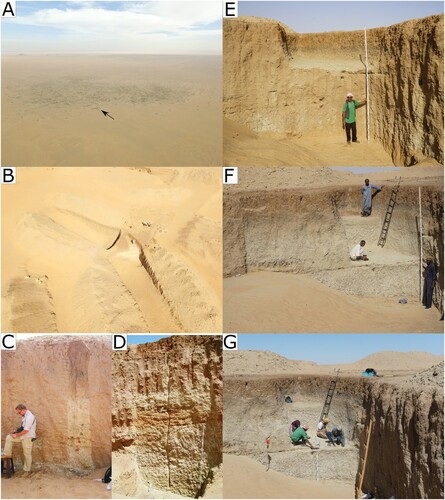
Figure 3. Radial plots of EDAR samples. The dark grey bar is centered at the CAM Dose (broken black line), and all the points that lie within the bar are consistent (at 2σ) with this dose. A) EDAR135-1; B) EDAR135-2; C) EDAR135-S4; and, D) EDAR135-S5.
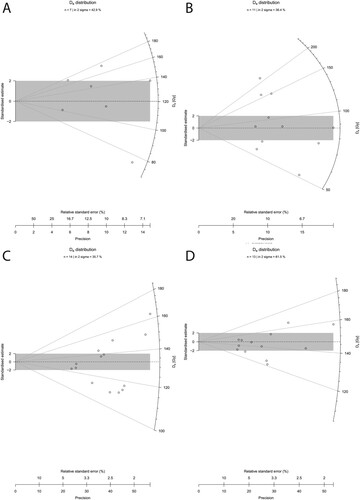
Table 1. OSL dating results.
Figure 4. Northern profile and chronology of EDAR 135. A) Stratigraphy and two cultural horizons with OSL results; B) results of granulometry analysis; and, C) calcium carbonate content.
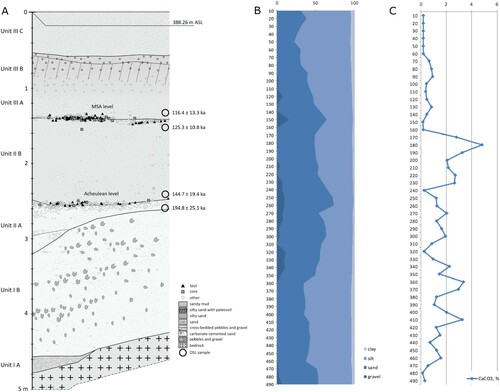
Figure 5. Spatial analysis results. A) Spatial distribution by artifact type; B) distribution of artifacts by weight; and, C) Kernel density.
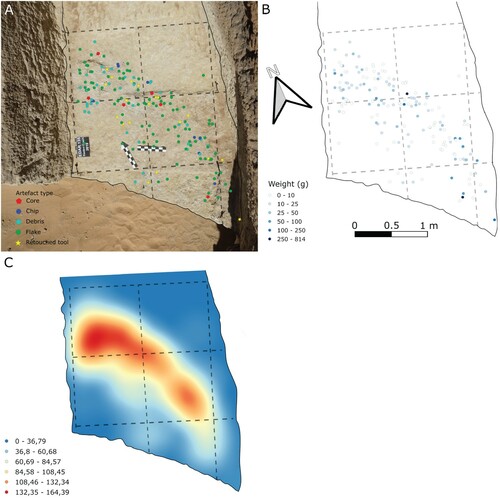
Table 2. Structure of lithic assemblage—number and weight of artifact classes by raw material.
Table 3. Dimensions of all artifacts.
Figure 6. Large Cutting Tools from EDAR 135: A) handaxe, quartz; B) basal fragment of a handaxe, rhyolite; and, C) chopper made from a rhyolite cobble.
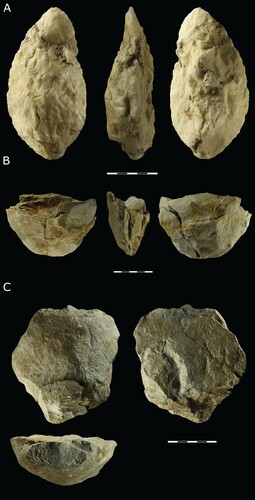
Figure 7. Cores made from quartz pebbles: A) bipolar and B) flake core with changed orientation.
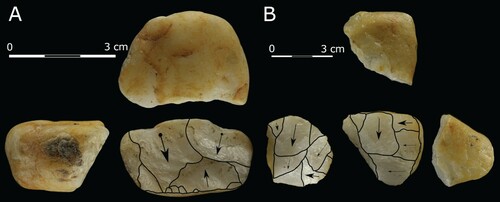
Figure 8. A) Levallois core (quartz) from EDAR 135, lower horizon and B) graphic presentation of scar pattern analysis results.
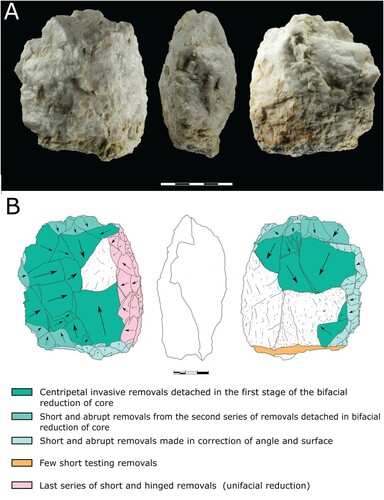
Figure 9. A) Discoidal core (quartz) from EDAR 135, lower horizon and B) graphic presentation of scar pattern analysis results.
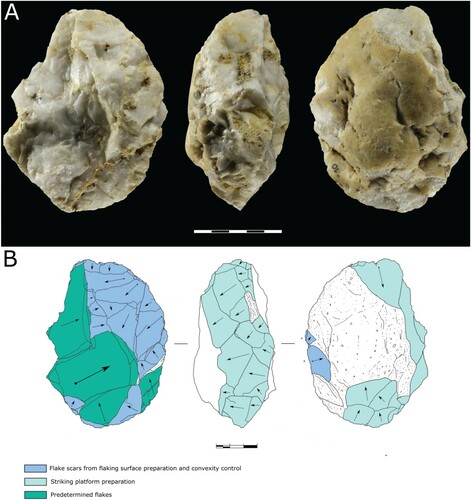
Figure 10. Retouched tools: A–B) sidescrapers and C–E) perforators. A) Rhyolite and B–E) quartz.
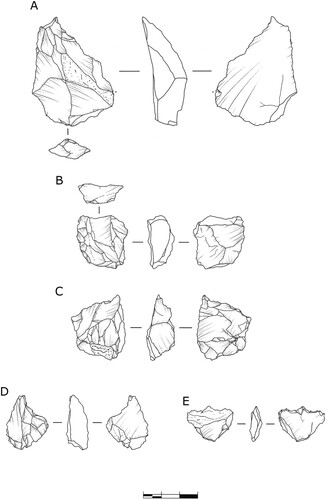
Figure 11. Retouched tools: A–D) denticulate; E) Levallois flake; and, F) retouched flake. A) Quartz; B) rhyolite; and, C–F) quartz.
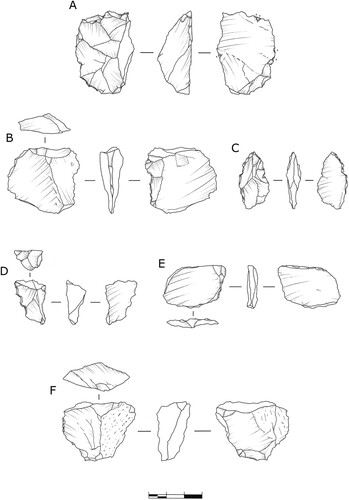
Figure 12. Use-wear analysis of artifacts from EDAR 135, lower horizon. A) Traces left by 1) contact with bone and 2) hide working. B) PDP alterations 3) covering almost the entire surface of the artifact.
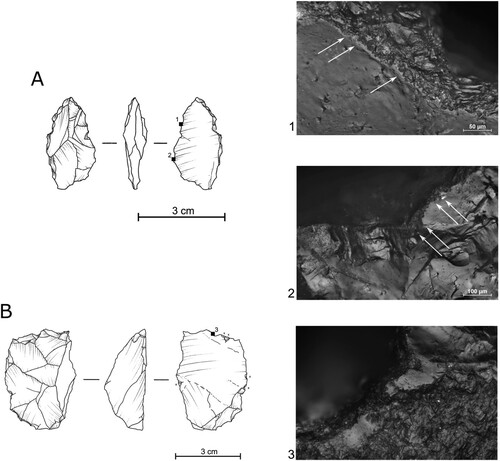
Table 4. Late Acheulean and Sangoan sites mentioned in the paper.