Figures & data
Figure 1. Gender of published Antiquity article authors from 1990, 2000, 2010 and 2020 (R. Witcher).
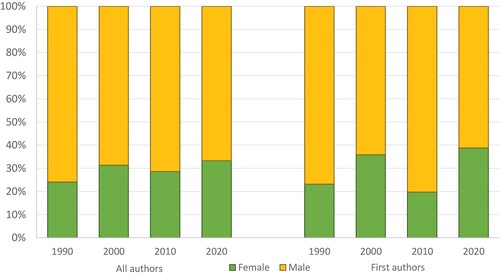
Figure 2. Gender of first-named authors for articles published in select archaeology journals, 2007–2016, based on survey responses reported in Heath-Stout Citation2020a (for journals with author responses totaling at least 4% of the overall dataset), plus data for Norwegian Archaeology Review (1968–2008; Bjerck Citation2008); Journal of Roman Studies (2005–2019; Kelly et al. Citation2019); Istanbuler Mitteilungen (1980–2018) and Paléorient (1980–2019; D’Anna et al. Citation2021, table 4); and, Journal of Computational Applications in Archaeology (2019–2021; Johnson Citation2022) (R. Witcher).
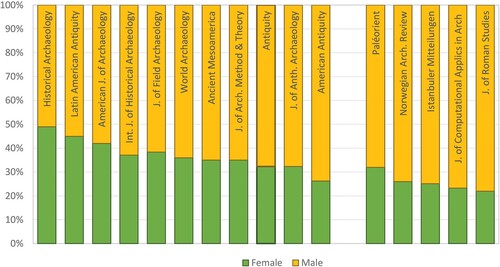
Figure 3. Numbers of authors listed on Antiquity submissions 2015–2020 (n = 1431) (R. Witcher).
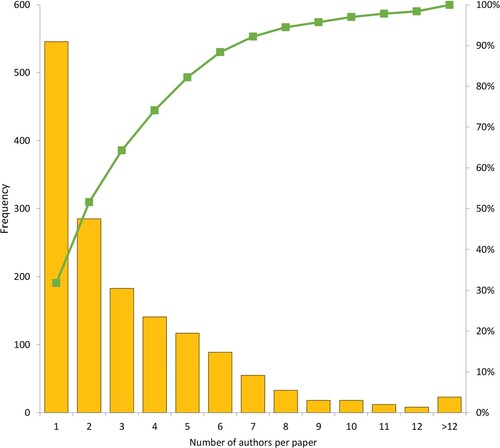
Table 1. Combinations of author gender on papers submitted, 2015–2020. All combinations comprising a minimum of 2% of the overall dataset (72 additional combinations account for the remaining 20.99% of submissions).
Figure 4. Female:male ratio of submitting authors, 2015–2020: A) all listed authors; B) first-named authors; and, C) solo authors, compared to mean, with upper and lower control limits (UCL and LCL, respectively) at 2 standard deviations (R. Witcher).
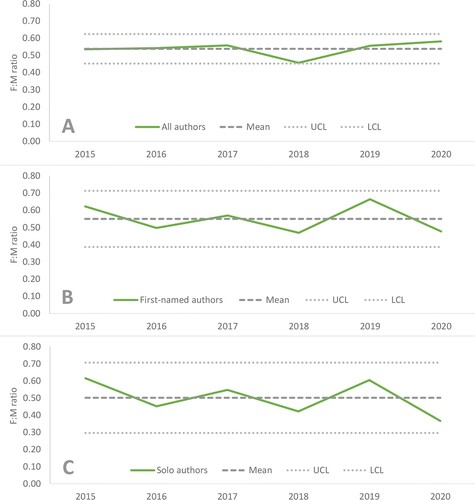
Figure 5. Map of female:male ratios of corresponding authors for 2015–2020 submissions for the top 14 countries by number of submissions (R. Witcher).
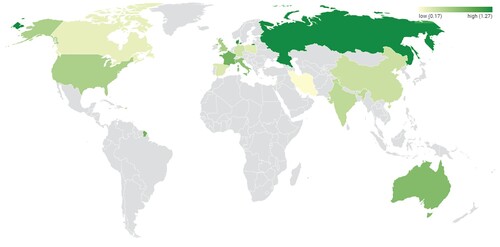
Table 2. Gender of corresponding authors for 2015–2020 submissions for the top 14 countries by number of submissions, ordered from highest to lowest ratio.
Figure 6. Female:male ratio of peer reviewers accepting invitation to review, 2015–2020, compared to mean, with upper and lower control limits (UCL and LCL, respectively) at 2 standard deviations (R. Witcher).
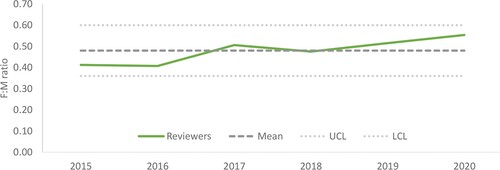
Figure 7. Editorial decisions on female and male first-authored papers expressed as a female:male ratio for A) minor and major revisions and B) reject before or after external review, compared to mean, with upper and lower control limits (UCL and LCL, respectively) at 2 standard deviations (R. Witcher).
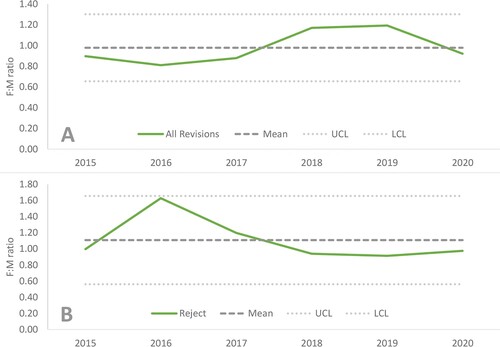
Figure 8. Comparison of female:male ratios for submissions between 2015 and 2020 by four categories of authorship. 2020, the first year of the pandemic, highlighted in yellow. Black bars indicate the six year mean female:male ratio for each category (R. Witcher).
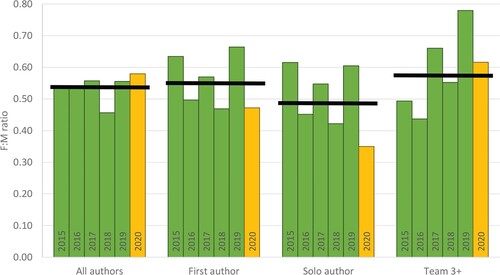
Figure 9. Female:male ratio of invited respondents to debate pieces, 2015–2021 (R. Witcher).
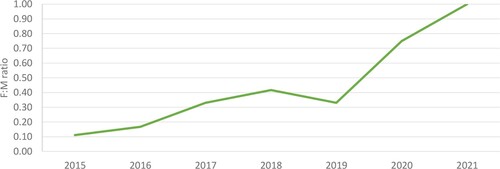
Figure 10. Example of Antiquity social media promotion (A. Benton).