Figures & data
Figure 1. A) Forensic traceable marking under UV light and B) MetTrace deterrent signage. Image Courtesy of SmartWater Group Ltd©.
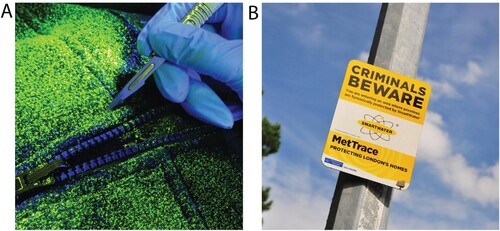
Figure 2. Crimes reported by Ecclesiastical vs. cumulative registrations of forensic traceable liquid. Image courtesy of DeterTech©.
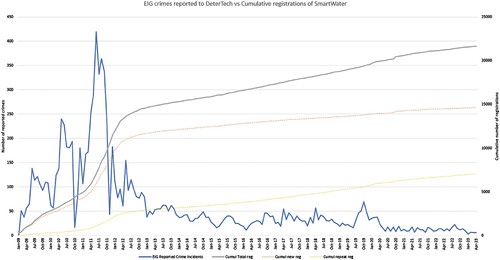
Figure 3. Forensic traceable liquid marking A) at the Hartshill Castle, UK and B) in Syria. Image Courtesy of SmartWater Group Ltd©.
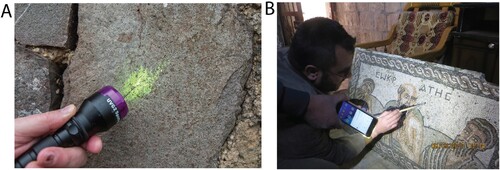
Figure 4. Forensic traceable liquid deterrent signage, Ironbridge Gorge Museums, UK. Image Courtesy of SmartWater Group Ltd©.
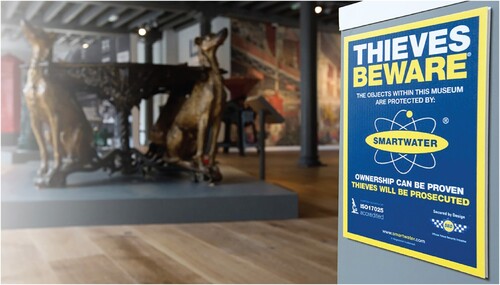
Figure 5. Forensic marking on archaeological objects A) under UV light and B) at the Iraqi National Museum, Baghdad. Image courtesy of Roger Matthews and Ali Al-Makhzoomi 2020©.
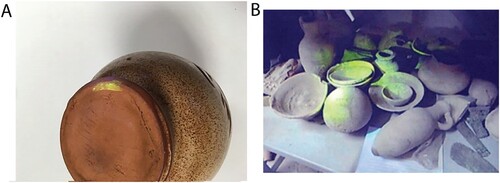
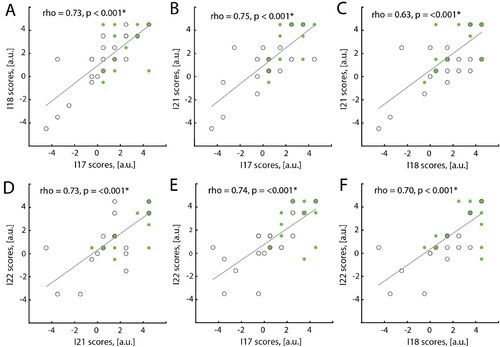
Figure 6. Cross-correlations for item pairs with significant difference between respondents in source (n = 18) and market (n = 22) countries. Of note, some responses overlapped; correlation between I2 and I3 is discussed in a separate research project (under review).