
Figures & data
Figure 1. Ratio of mean bootstrap estimate of standard deviation to the empirical standard deviation of sampling distribution: τ2.
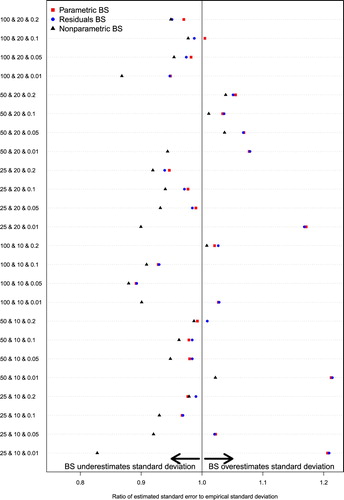
Figure 2. Ratio of mean bootstrap estimate of standard deviation to the empirical standard deviation of sampling distribution: VPC.
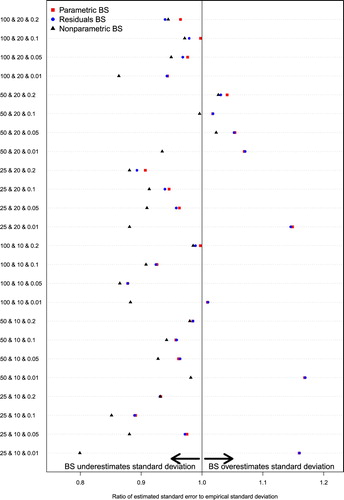
Figure 3. Ratio of mean bootstrap estimate of standard deviation to the empirical standard deviation of sampling distribution: MOR.
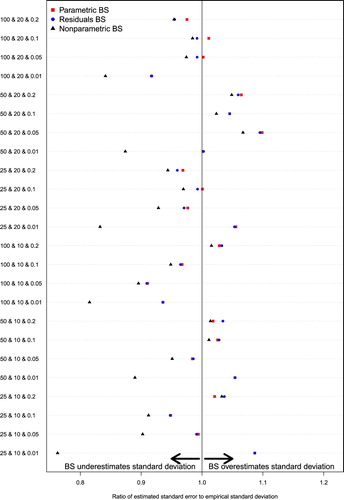
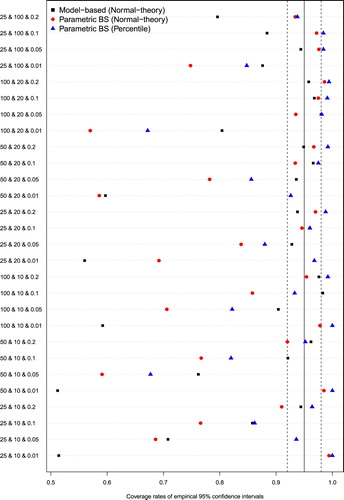
Figure 4. Empirical coverage rates of 95% confidence intervals for τ2/VPC/MOR.
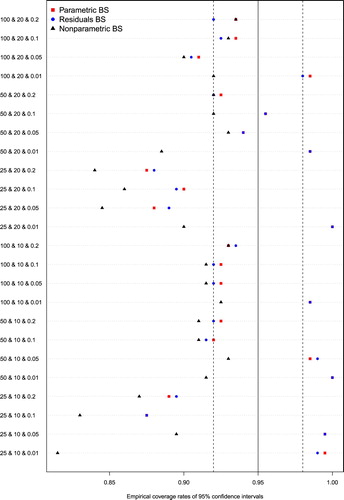
Figure 5. Ratio of mean estimated standard error to empirical standard deviation of sampling distribution.
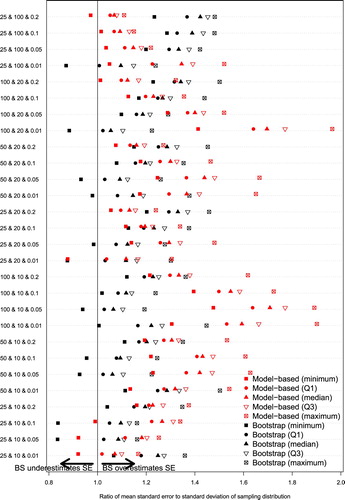
Figure 6. Coverage rates of 95% CIs for cluster-specific random effects.
Supplemental material