
Figures & data
Figure 1. Example hit curves. Panel (a) shows curves A, B and C. Hit curve A is superior to B, while C has performance only comparable with random ranking. In panel (b) hit curves D and E cross each other at several locations making their comparison more difficult.
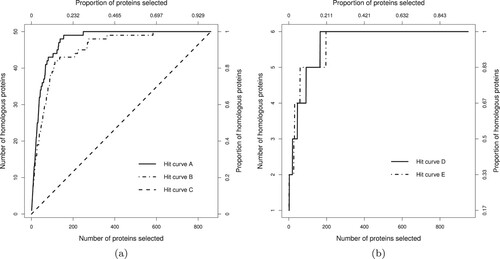
Table 1. A toy example showing complementary ranking behaviour of the evaluation metrics.
Figure 2. Given an assessment metric, d feature variables are formed into p phalanxes to be used into an ensemble of phalanxes. The M ensemble of phalanxes, one for each assessment metrics, are then aggregated across assessment metrics into an ensemble of phalanxes and metrics (EPX-EOM).
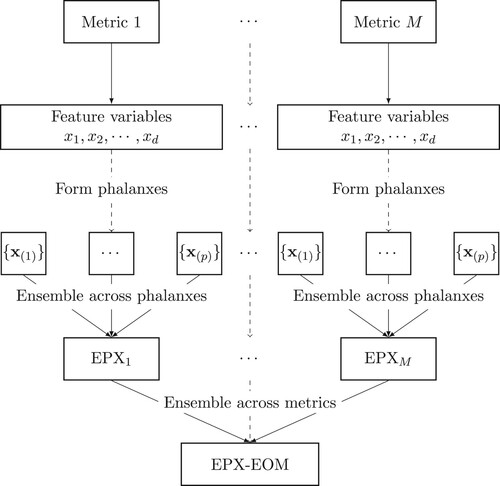
Figure 3. Density plots of the feature variables 63 (panel a) and 47 (panel b) for the homologous (solid line) and non-homologous proteins (dashed line) in the training data.
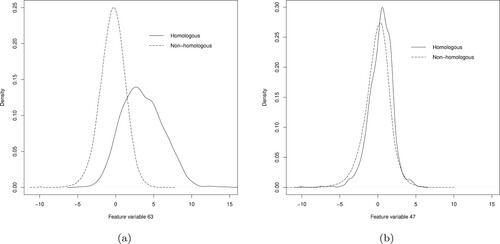
Table 2. Number of candidate and filtered phalanxes identified by EPX and the sizes of the filtered phalanxes.
Table 3. Training (10-fold CV) and test set APRs for each of the three EPX phalanxes of feature variables found by maximizing APR and for the EPX-APR ensemble.
Table 4. Training (10-fold CV) and test RKLs for the two phalanxes of feature variables obtained by minimizing RKL and for the EPX-RKL ensemble.
Table 5. Ten-fold CV training performances and test performances – in terms of APR, TOP1 and RKL – of the ensemble of phalanxes optimizing APR (EPX-APR), ensemble of phalanxes optimizing RKL (EPX-RKL), and their ensemble (EPX-EOM).
Table 6. Test metrics for EPX-APR, EPX-RKL and EPX-EOM (first section), the winners of the KDD cup competition (second section), three top performers from the ongoing competition (third section), and RF and EPX-RF (fourth section).
Figure 4. Training data 10-fold CV LR probability of homology from phalanx 2 versus phalanx 3 for phalanx formation algorithm optimizing APR: (a) homologous and (b) non-homologous proteins in the training data. In the smaller and larger top-right corners, the probabilities of homology from both phalanxes are greater than 0.90 and 0.70, respectively; whereas in the bottom-left corner, the probabilities are less than 0.20.
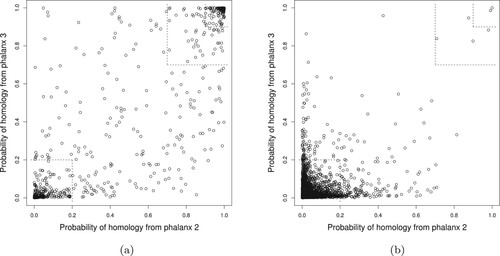
Figure 5. Training data 10-fold CV LR probability of homology from phalanx 1 versus phalanx 2 for phalanx formation minimizing RKL: (a) homologous and (b) non-homologous proteins proteins in the training data. In the smaller and larger top-right corners, the probabilities of homology from both phalanxes are greater than 0.90 and 0.70, respectively; whereas in the bottom-left corner, the probabilities are less than 0.20.
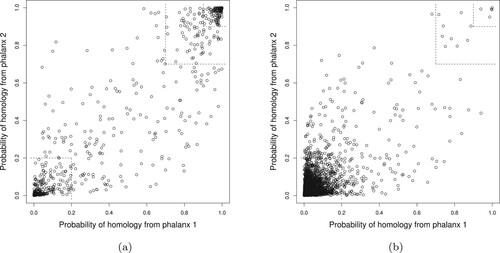
Table 7. Comparison of ranking performance of EPX-APR versus EPX-RKL for all training-data homologous compounds, categorized by the overall ranking performance of EPX-EOM.
Table 8. Assessment metrics APR, TOP1 and RKL for EPX-APR, EPX-RKL and EPX-EOM from CV for training blocks 95, 216, 96 and 238.
Table 9. Parallel computation time in minutes for EPX-LR, EPX-RF and RF using Western Canada Research Grid (WestGrid).