
Figures & data
Figure 1. Estimated densities of angular displacement (degrees) between the population and sample eigenvectors as a function of covariance matrix pattern, covariance matrix parameter (ρ) and sample size (n), for both normal and non-normal parent populations. Shaded area correspond to cosines between 0.95 and 1 (stable solutions) (a) First eigenvector (b) Second eigenvector.
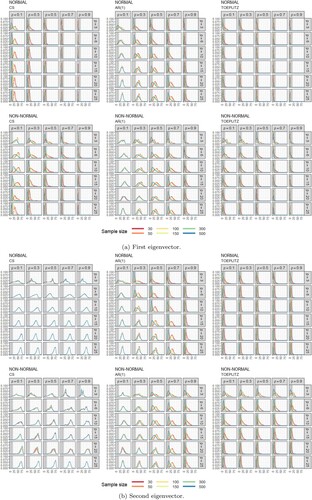
Table 1. Simulation parameters.
Figure 2. QQplots comparing the empirical distribution of the angle between the population and sample eigenvectors under normal and non-normal parent populations as a function of covariance matrix pattern, covariance matrix parameter (ρ) and sample size (n). Shaded area correspond to cosines between 0.95 and 1 (stable solutions). (a) First eigenvector (b) Second eigenvector.
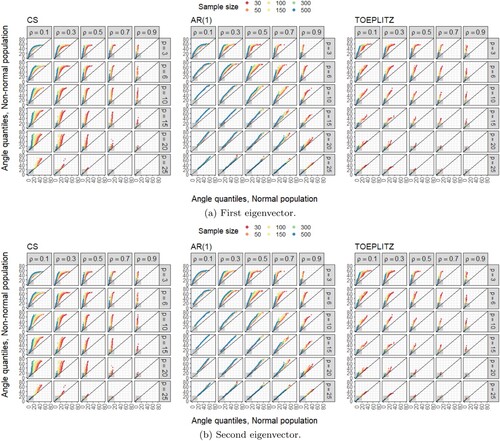
Figure 3. Estimated densities of the global angular displacement as a function of covariance matrix pattern, covariance matrix parameter (ρ) and sample size (n), for both normal and non-normal parent populations. Dashed vertical lines correspond to perfect stability. (a) First 2 principal components () (b) All principal components (
).
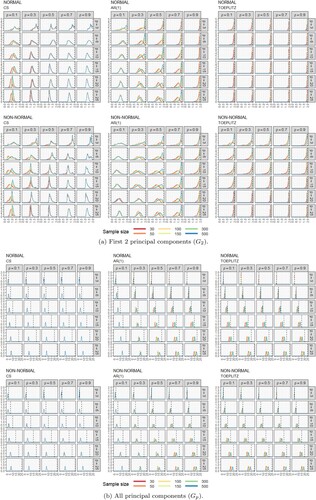
Figure 4. ROC curves. (a) First principal component (b) Second principal component.
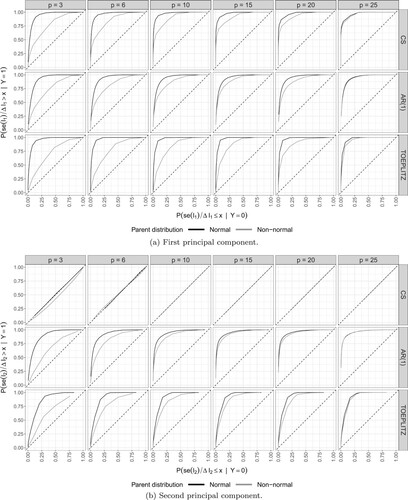
Table 2. Stability diagnosis summary (Equation (Equation8(8)
(8) )) applied to Swiss Army real data datasets [Citation37].