
Figures & data
Table 1. Mean marginal accuracies (Acc.) (expressed as a percentage) and times (in seconds) across probit regression simulations with independent covariate data. The highest accuracies for each value of p appear in bold.
Figure 1. Contour plots for the posterior and across various approximation methods, for a small probit regression example with p = 2 and n = 4.
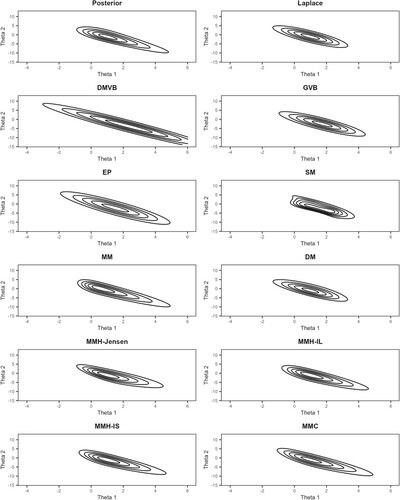
Table 2. Mean marginal accuracies (Acc.) (expressed as a percentage) across probit regression benchmarks. The highest accuracies for each benchmark dataset appear in bold.
Table 3. Mean total marginal improvement/deterioration of accuracies (expressed as a percentage) across probit regression post-hoc simulations with independent covariate data. The column ‘+’ indicates a mean total improvement in marginal
accuracy, while the column ‘−’ indicates the mean total decrease in marginal
accuracy across simulations. For example, if the marginal improvements in
accuracy for a p = 4 example were
, then the total marginal
improvement and deterioration are 6 and 5 respectively. Pairs where there is an overall improvement are highlighted in bold. Long dashes indicate no data.
Table 4. Success rates, i.e. rates where a solution exists to Algorithm 4, (expressed as a percentage) averaged over base approximations for the mean-mode-covariance based skewness adjustment. The mean-mode-Hessian based adjustments had a 100% success rate.
Table 5. Mean total marginal improvement/deterioration in accuracies (expressed as a percentage) across probit regression post-hoc benchmarks. The ‘+’ columns indicates the total increases in marginal
accuracy, while the ‘−’ column indicates the total decrease in marginal
accuracy. For example, if the marginal improvements in
accuracy for a p = 4 example were
, then the total marginal
improvement and deterioration are 6 and 5 respectively. Pairs where there is an overall improvement are highlighted in bold. Long dashes indicate no data.