
Figures & data
Table
Table 1. Efficiency gain when no outliers exist in the data and errors follows AR (1).
Table 2. Efficiency gain when outliers exist in the data and errors follow AR (1).
Table 3. Bias of the estimate and MSE when no outliers exist, and errors follow AR (1).
Table 4. Bias of the estimate and MSE when outliers exist, and errors follow AR (1).
Table 5. Type I error of asymptotic test HM and F for when error follows AR (1).
Table 6. Type I error for individual t-test for testing and
under AR(1).
Table 7. Comparison of SE estimated through asymptotic and bootstrap approaches when no outliers.
Table 8. Comparison of SE estimated through asymptotic and bootstrap approaches when outliers.
Figure 1. Power with normally distributed errors and no outliers (left panel) and non-normality for errors and outliers existing (right panel).
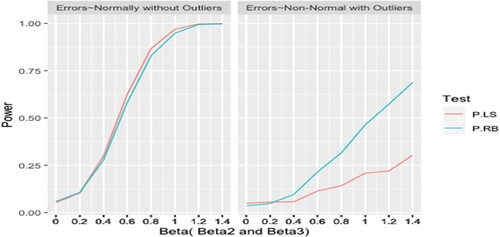
Figure 2. Time series plot for the rate of organ trafficking per million population.
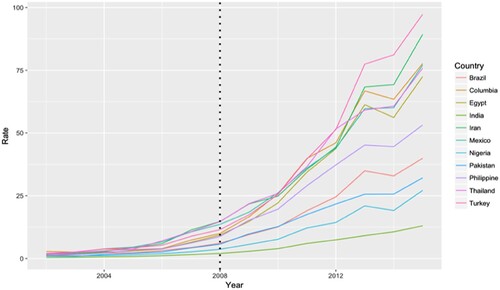
Figure 3. Time series plot for the log-rate of organ trafficking per million population.
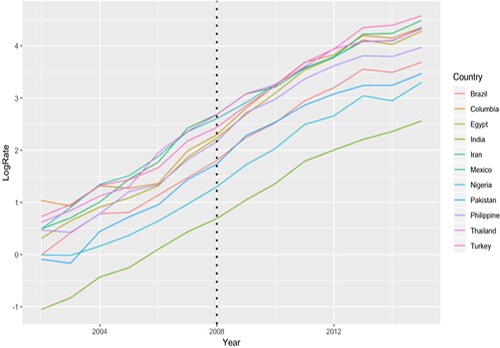
Table 9. Results of standard ls regression analysis.
Table 10. Bootstrap results of standard ls regression analysis.
Table 11. Results of rank-based regression analysis.
Table 12. Bootstrap results of rank-based regression analysis.
Figure 4. Thailand and Turkey fitted model.
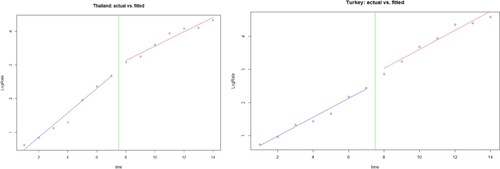
Table 13. Comparisons of HM and F-test for testing .