Figures & data
Figure 1. A. Concept of theory of change (ToC): activities in green, intermediate outcomes in yellow and long-term outcome in blue (Adapted from Belcher & Claus, Citation2020). ToC is created using a backwards mapping process: first, the desired long-term goals; second, the intermediate outcomes; and third, the activities. After defining these three elements, the interviewees draw the arrows to connect the different variables, creating a complex web of assumptions about what needs to happen to bring about change (Center for Theory of Change, Citation2021); B. Example of a hand-drawn ToC diagram done by an interviewee; and C. Digital version of the same ToC, with the long-term and intermediate outcomes coded according to the classification matrix.
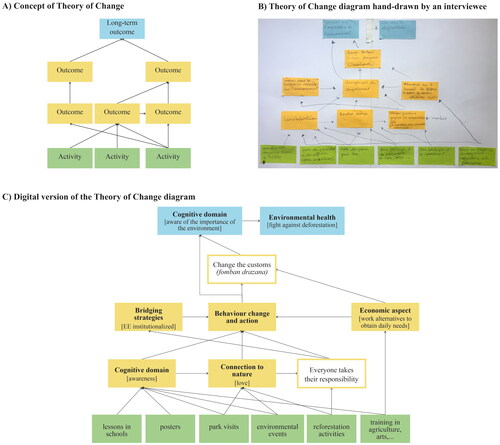
Figure 2. Interactions among the five core outcomes of environmental education (EE) (adapted from Clark et al., Citation2020) are represented here as a theory of change (based on Krasny Citation2020). This is just an abstraction of the five core outcomes, as not all EE programs focus on environmental quality as their long-term goal. For example, some may aim to increase skills and competencies as their ultimate outcome.
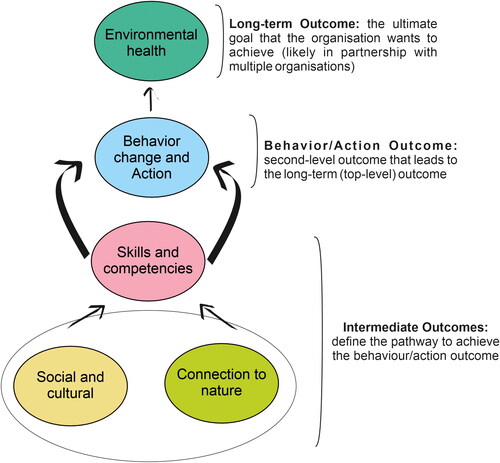
Figure 3. Methodology flow chart. The chart describes each of the steps of the data analysis, connecting them with the corresponding table and figures.
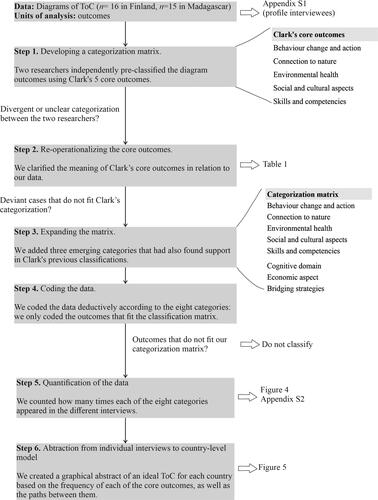
Table 1. Core outcomes (Adapted from Clark et al., Citation2020).
Figure 4. Bar graph illustrating the number of interviewees (y axis) that mentioned at least once the outcomes classified into each of the eight categories (x axis), differentiated between Finland (green) and Madagascar (purple) and long-term outcomes (dark color) and intermediate outcomes (light color).
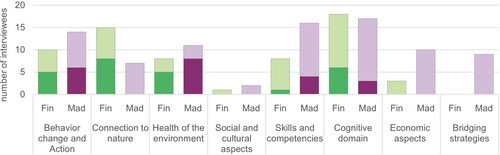
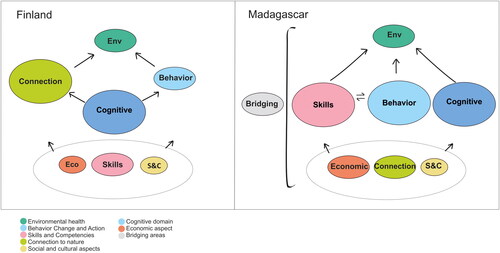
Figure 5. Core outcomes for environmental education in Finland (on the left) and Madagascar (on the right). The three different sizes of the bubbles indicate how often different interviewees mentioned that outcome (from small to big, less to more often). The top outcomes are the ones defined as long-term outcomes, whereas the bottom ones are the intermediate outcomes.