Figures & data
Table 1. Claims made about bioenergy and facts that counter those claims
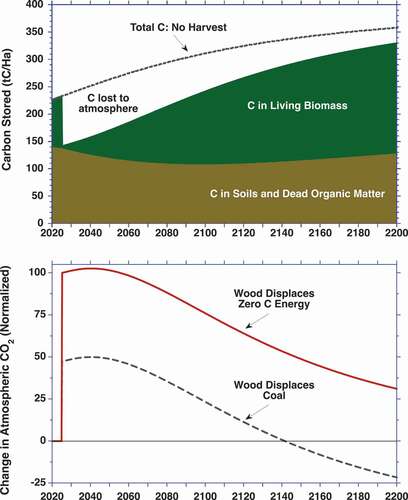
Figure 1. Life cycle emissions from wood bioenergy. Every stage of the supply chain adds carbon dioxide to the atmosphere, from cutting the trees through transport, processing the wood into chips or pellets, transporting them to a power plant, and combustion. Carbon dioxide is removed only later, and only if, the harvested land regrows. Photo credits, left to right: Power Plant, courtesy of Paul Glazzard, Creative Commons Attribution-ShareAlike 2.0 license. Transport: Handymax bulk carrier, courtesy of Nsandel/Wikimedia/Public Domain. Pellet mill, Truck Transport, and Forest images all courtesy of Dogwood Alliance, used with permission.
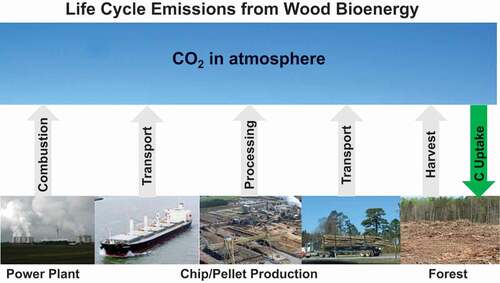
Figure 2. Impact of harvesting wood for bioenergy in 2025 from a 50-year-old oak-hickory forest in the south central USA. Top: Change in carbon on the harvested land (tons carbon per hectare). Brown: carbon in soils and dead organic matter; Green: carbon in living biomass. Dotted line: the total carbon stock (living biomass and soils) if the forest were not harvested in 2025. The forest would have continued to grow and remove carbon from the atmosphere but for being cut for bioenergy. The difference between the dotted no-harvest line and the top of the green band is the carbon emitted into the atmosphere by the harvest. Bottom: Change in atmospheric carbon dioxide resulting from the harvest and combustion of the wood. Solid line: wood displaces a zero-carbon energy source. Dotted line: wood displaces coal. Scale: the initial rise in atmospheric carbon dioxide when wood displaces zero-carbon energy is normalized to 100 percent. The initial rise in atmospheric carbon dioxide when wood displaces coal is about 50 percent less due to the emissions avoided by the reduction in coal use.