
Figures & data
Figure 1. The ranges show average time elapsed from oral arguments to final decision for civil and criminal cases on the Norwegian Supreme Court between 2008 and 2019.
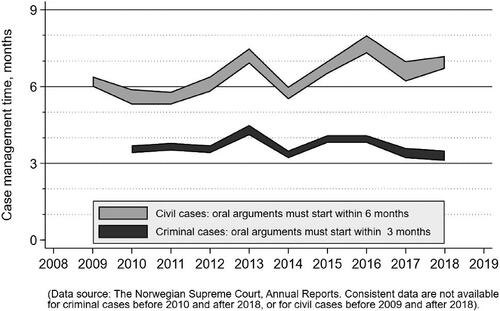
Figure 2. An equal probability histogram plot of the Norwegian Supreme Court’s case disposition time in days (mean = 13.24, sd = 8.3), with a Kernel density curve superimposed.
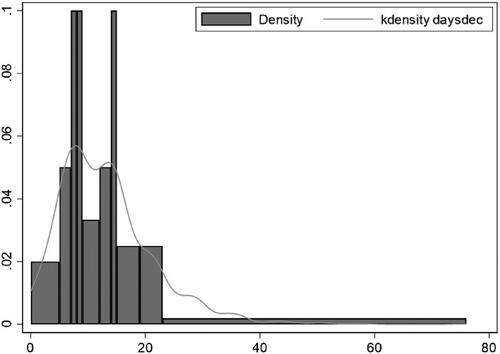
Table 1. Summary statistics.
Table 2. Regression results from models of the duration of case disposition time.
Figure 3. Relative hazard of female presiding justice.
Note. The solid line represent the relative hazard of switching from male presiding justice (=0) to female presiding justice (=1). Thin lines indicate 95% confidence intervals. The effect of female presiding justice on case disposition time is insignificant when the confidence intervals cover the value of 1.
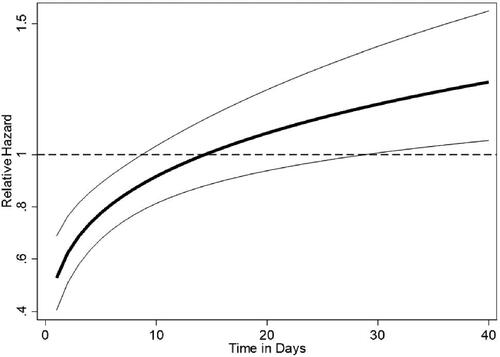
Figure 4. First difference summary of the effects of controls with time-varying components.
Note. Solid lines represent the median change based on a random draw of 1000 estimates from Model 4 in , and thin lines indicate 95% confidence intervals. For continuous variables including case complexity, average experience, and workload (log), the plots depict the first difference for a move from the mean to one standard deviation above the mean. For categorical variables including opinion heterogeneity and the number of law professors, the plots depict the first difference for a move from the minimum to the maximum. The effect of controls is statistically insignificant when confidence intervals include zero.
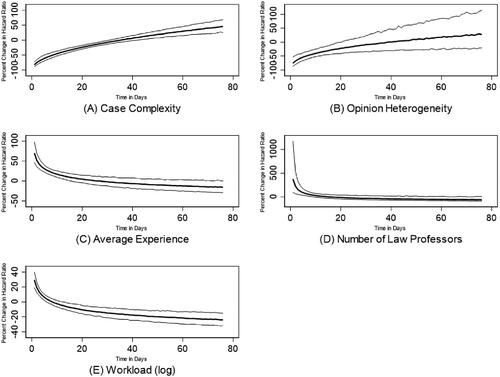
Table A1. Regression results from models of the duration of case disposition time. The first column reproduce Model 4; the second column adds three experience-related variables.