Figures & data
Table 1. Chemicals used in this study.
Figure 1. The architecture of an artificial neural network with three layers: input, hidden and output. Letters w and b stand for adjustable weights and bias, respectively.
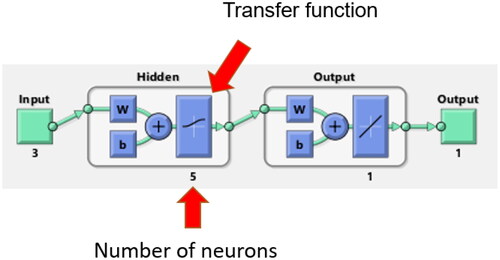
Table 2. Exponents D and E that gave the best fitting and corresponding root mean square deviations, RMSD (EquationEquation 4(4)
(4) ) and r2 (EquationEquation 5
(5)
(5) ), obtained by fitting EquationEquation (1)
(1)
(1) to binodal data of systems containing ethyl lactate, water and salt.
Figure 2. Average coefficient of determination (r2) obtained using different exponents of Merchuk’s equation (EquationEquation 1(1)
(1) ), fitted to binodal data given in Table S1 for the systems containing ethyl lactate, water and various salts at 298 K.
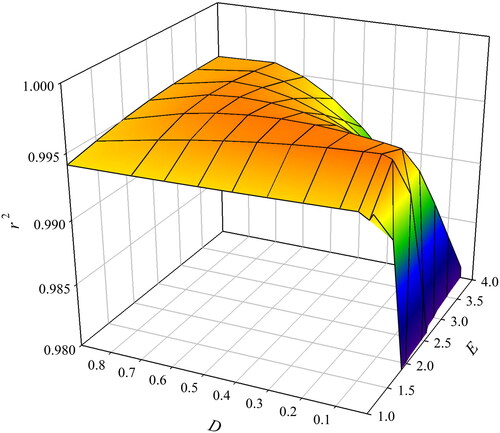
Figure 3. Comparison of coefficient of determination (r2) obtained by fitting Merchuk’s equation (EquationEquation 1(1)
(1) ) for the systems containing ethyl lactate, water and various salts system at 298 K, using two different sets of exponents: D = 0.05 and E = 1.5 (black bars) and D = 0.5 and E = 3 (white bars).
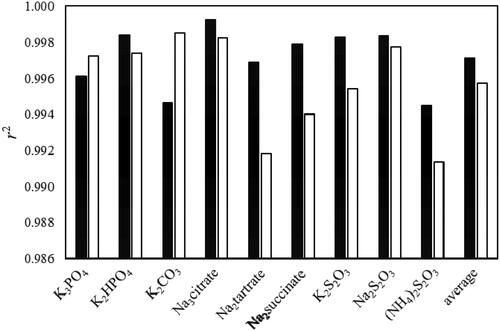
Table 3. Summary of root mean square deviations (RMSD from EquationEquation 4(4)
(4) ) and coefficient of determination (r2 from EquationEquation 5
(5)
(5) ) obtained using EquationEquation (2)
(2)
(2) .
Table 4. Summary of root mean square deviations (RMSD from EquationEquation 4(4)
(4) ) and coefficient of determination (r2 from EquationEquation (5)
(5)
(5) ) obtained using EquationEquation (3)
(3)
(3) .
Table 5. Summary of root mean square deviations (RMSD from EquationEquation 4(4)
(4) ) and coefficient of determination (r2 from EquationEquation 5
(5)
(5) ) obtained using EquationEquation (3)
(3)
(3) , assuming that f213 = 0.
Figure 4. Binodal lines for the nine ABS containing ethyl lactate, water and salt (Na3citrate—black, K3PO4—grey, Na2tartrate—bark blue, K2HPO4—red, Na2S2O3—yellow, Na2succinate—green, K2S2O3—brown, (NH4)2S2O3—pink and K2CO3—light blue) obtained by fitting EquationEquation (3)(3)
(3) using constants given in , expressed in molalities (m). The insert shows the obtained values for
for each system (the same color code applies).
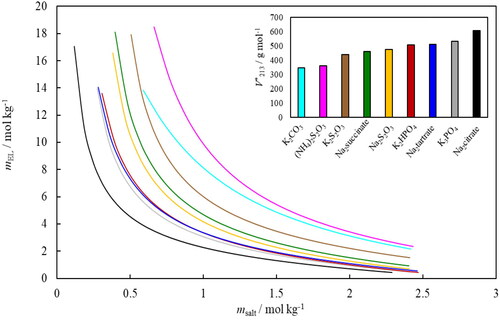
Figure 5. Effective excluded volume, (), as a function of molecular masse of salt.
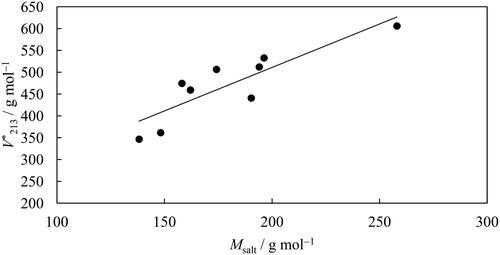
Figure 6. Relationship of average RMSD and transfer functions in the hidden layer.
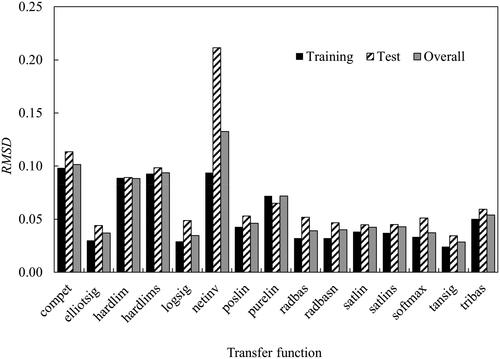
Figure 7. Relationship of average RMSD and the number of neurons in the hidden layer.
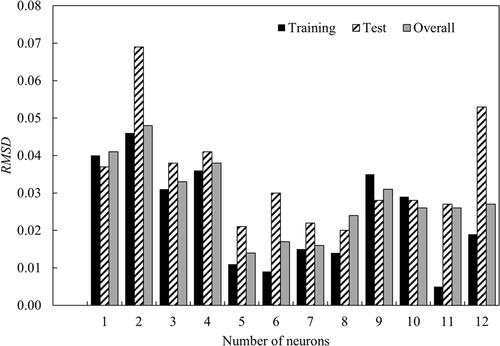
Figure 8. (a) Regression of training, validation and test steps for the optimum artificial neural network architecture. (b) Error histogram diagram.
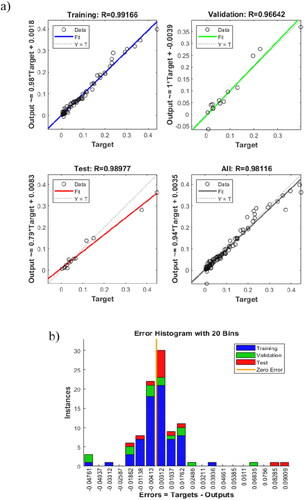
Table 6. Summary of the statistics of the ANN model.
Figure 9. Predicted binodal lines using the ANN model for (a) water-ethyl lactate-K2S2O3 system; (b) water-ethyl lactate-Na2 succinate system. The training dataset included 95 experimental data points for seven ternary systems containing different salts, K3PO4, K2HPO4, K2CO3, Na3-citrate—Na3C6H5O7, Na3-tartrate—Na2C4H4O6, Na2S2O3 and (NH4)2S2O3).
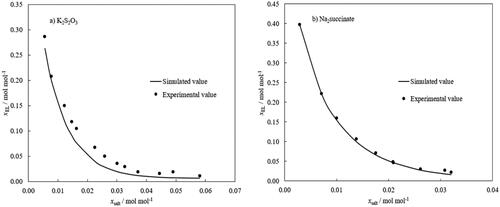
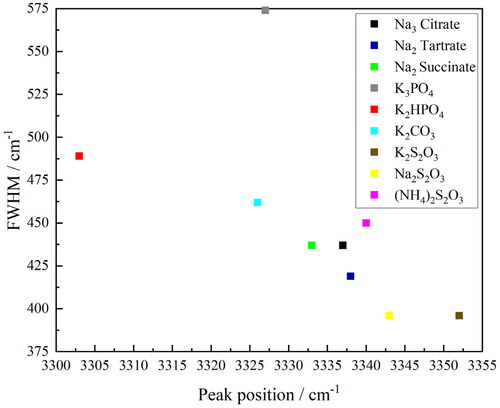
Figure 10. FTIR–ATR spectra of the salt-rich ternary solutions (Na3 citrate—black, Na2 tartrate—dark blue, Na2 succinate—green, K3PO4—grey, K2HPO4—red, K2CO3—light blue, K2S2O3—brown, Na2S2O3—yellow and (NH4)2S2O3—pink) between 2400–3800 cm−1.
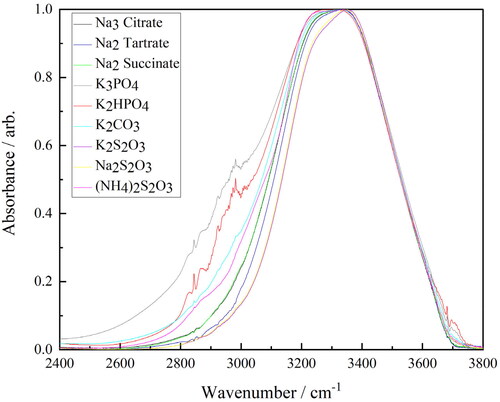
Figure 11. Full-width half maxima (FWHM) of the peak versus peak position for the O–H band in the FTIR–ATR spectra of the salt-rich ternary solutions (Na3 citrate—black, Na2 tartrate—dark blue, Na2 succinate—green, K3PO4—grey, K2HPO4—red, K2CO3—light blue, K2S2O3—brown, Na2S2O3—yellow and (NH4)2S2O3—pink).