Figures & data
Fig. 1 Root growth rate in high- and low-yielding soybean pools across all growth stages. Note: * indicates growth stages at which the root growth rates of the two yielding pools were significantly different at P < 0.05; bars represent standard error of the mean (n = 4)
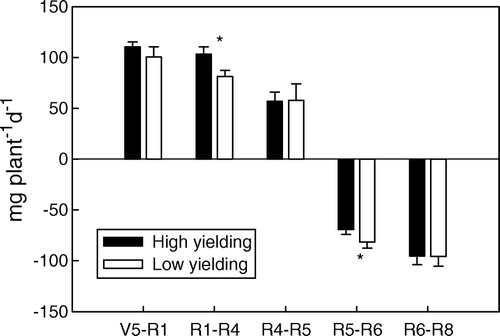
Fig. 2 Root biomass (A) and root-to-shoot ratio (B) in high- and low-yielding soybean pools across all growth stages. Note: * and ** indicate growth stages at which root biomasses or root-to-shoot ratios of the two yielding pools were significantly different at P < 0.05 and P < 0.01, respectively; bars represent standard error of the mean (n = 4)
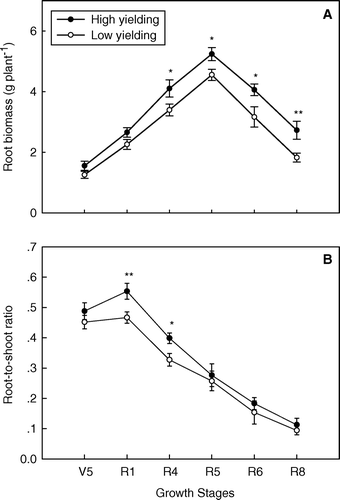
Fig. 3 Root length (A) and average root diameter (B) in high- and low-yielding soybean pools across all growth stages. Note: * and ** indicate growth stages at which root lengths or root diameters of the two yielding pools were significantly different at P < 0.05 and P < 0.01, respectively; bars represent standard error of the mean (n = 4)
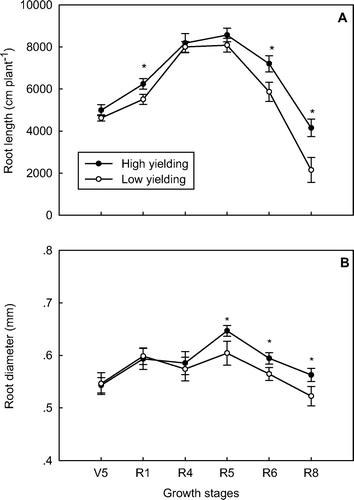
Table 1 Root length among seven root-diameter classes in real value and percentage distribution for two yielding soybean pools at the R6 stage
Fig. 4 Relationship between root length duration (RLD) and leaf area duration (LAD) in high (A) and low (B)-yielding soybean pools. Note: ** indicates a linear correlation coefficient significant at P < 0.05
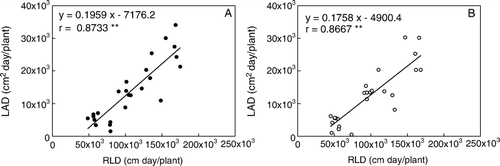
Fig. 5 Root biomass density in high- and low-yielding soybean pools along soil profiles, for each of following positions: on plant (A); at halfway between plants (B); at halfway between rows (C). Note: *, ** and *** indicate depths at which root biomass densities of the two yielding pools were significantly different at P < 0.05, P < 0.01 and P < 0.001, respectively; bars represent standard error of the mean (n = 4)
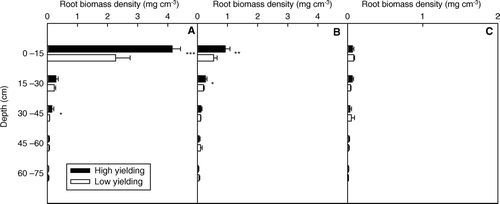
Fig. 6 Root length density in high- and low-yielding soybean pools along soil profiles, for each of following positions: on plant (A); at halfway between plants (B); at halfway between rows (C). Note: * and ** indicate depths at which root densities of the two yielding pools were significantly different at P < 0.05 and P < 0.01, respectively; bars represent standard error of the mean (n = 4)
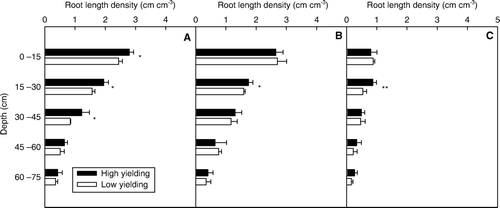
Fig. 7 Average root diameter in high- and low-yielding soybean pools along soil profiles, for each of following positions: on plant (A); at halfway between plants (B); at halfway between rows (C). Note: * and ** indicate depths at which average root diameters of the two yielding pools were significantly different at P < 0.05 and P < 0.01, respectively; bars represent standard error of the mean (n = 4)
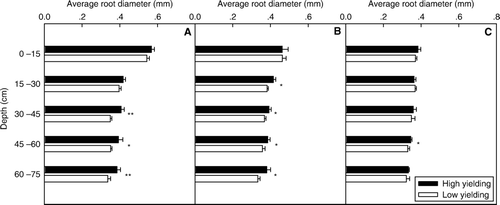
Fig. 8 Root-to-soil volume ratio in high- and low-yielding soybean pools along soil profiles, for each of following positions: on plant (A); at halfway between plants (B); at halfway between rows (C). Note: * and *** indicates depths at which root-to-soil volume ratios of the two yielding pools were significantly different at P < 0.05 and P < 0.001, respectively; bars represent standard error of the mean (n = 4)
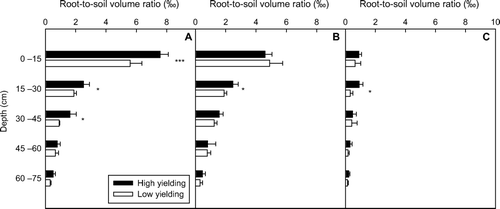
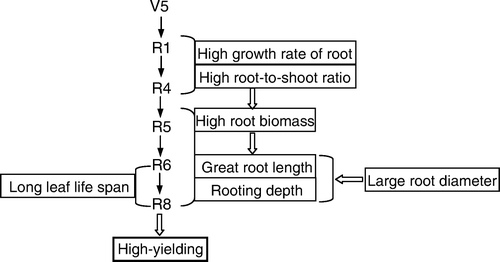
Fig. 9 A diagram describing the characteristics of root morphology of high-yielding soybean in the north-east of China