Figures & data
Figure 1 A, Geographic location of the Te Puke kiwifruit growing region within New Zealand; B, location of model orchards (○) and test orchards (▴) within the Te Puke growing region.
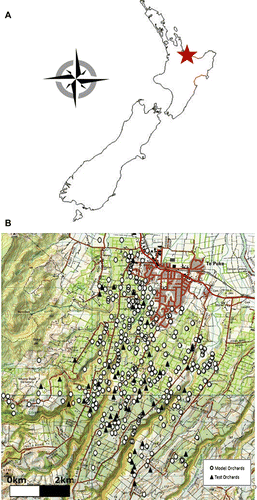
Table 1 Summary statistics of Hayward kiwifruit orchard fruit dry matter content within the Te Puke growing region across consecutive seasons (2003–08). Measures of variation are between-orchard for each individual season and between-season for the 2003–08 figure.
Figure 2 Modelled spatial variation between ‘Hayward’ kiwifruit orchards average fruit DM content at commercial harvest within the Te Puke growing region over consecutive growing seasons (2003–08).
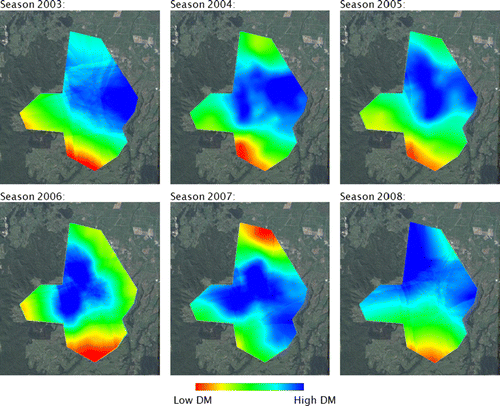
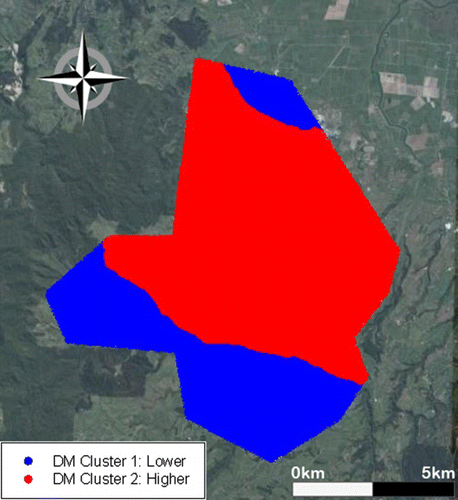
Figure 3 Geographic location of ‘Hayward’ kiwifruit orchard DM groupings across the Te Puke growing region as identified by k-means clustering. Clusters 1 and 2 contained 57 and 231 of the 288 model orchards, respectively. The fruit DM and altitudes of the orchards located within each geographic cluster are summarized in and , respectively.