Figures & data
![Figure 1 A, Mean monthly minimum and maximum temperatures, and B, mean monthly rain and pan evaporation at Wagga Wagga, New South Wales, Australia.](/cms/asset/53fc286e-6850-46a4-a883-5f4b2e814252/tnzc_a_891527_f0001_b.jpg)
Table 1 Physical characteristics of the soil at the experimental site.
Table 2 Amount of irrigation water applied to the three water treatments during the two experimental seasons (2010–11 and 2011–12).
![Figure 2 Soil water retention curve for the four depth layers of the Red Kandosol soil in the study area.](/cms/asset/ba71e38e-d899-4d2d-ad4f-f906b352ea77/tnzc_a_891527_f0002_b.jpg)
![Figure 3 Cumulative values of soil water balance components in the 2010–11 and 2011–12 experimental period for rainfed, deficit and irrigated treatments. Each data point is an average of three values. End-of-hydrological year values are indicated on respective data plots. DP, deep percolation; ETc, crop evapotranspiration.](/cms/asset/eea8103d-5035-4ba8-b3e8-9ec2453f4197/tnzc_a_891527_f0003_b.jpg)
![Figure 4 Average soil water content at the beginning of the first year (20 September 2010), end of first year or beginning of second year (20 September 2011) and end of the second year (20 September 2012) for the three treatments: rainfed, deficit and irrigated.](/cms/asset/1aab1bb6-e96a-42a3-a27a-8813e10516d2/tnzc_a_891527_f0004_b.jpg)
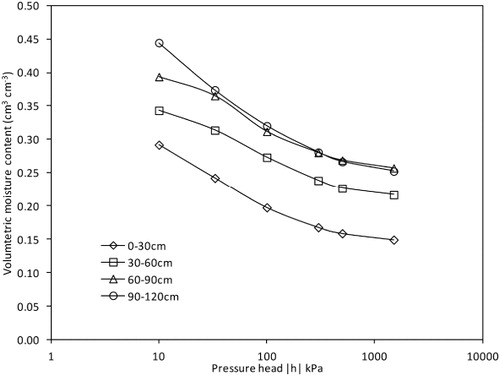
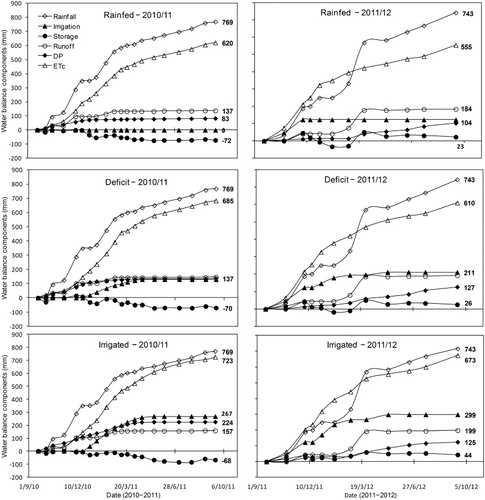
Table 3 Seasonal and annual water balance components of rainfed, deficit irrigated and fully irrigated olives during the two experimental years (2010–11 and 2011–12).
![Figure 5 Average soil water content variation: A–C, for the 0–60 cm and 60–120 cm layers for the three irrigation treatments rainfed, deficit and irrigated and, D, in the 0–120 cm soil layer. FC1, WP1, FC2 and WP2 refer to field capacity and permanent wilting point water contents of the upper (0–60 cm) and lower (60–120 cm) layers, respectively. High rainfall events are indicated by arrows. Standard error bars are also indicated.](/cms/asset/dfb22455-b696-4eee-889d-015f9a30f62a/tnzc_a_891527_f0005_b.jpg)
![Figure 6 Average soil water content depletion relative to the soil water content at the beginning of the experimental period (20 September 2010) per 30 cm layers (A–C) and per 60 cm layers (D–F). Major rainfall events are indicated with broken line arrows. Standard error bars are also indicated. For the 30 cm layers, error bars of the major root zone (30–60 cm) and the deeper layer (90–120 cm) are presented.](/cms/asset/1efc5e27-c32c-4903-9e36-5e7ab84b452c/tnzc_a_891527_f0006_b.jpg)
![Figure 7 Average soil water content at different depths and horizontal positions at the beginning, mid and end of the experimental period. X75 and X200 indicate soil water monitoring positions located 75 and 200 cm from the tree trunk in the direction of the olive orchard rows, respectively. Y75 and Y200 indicate similar positions but across the tree rows.](/cms/asset/ebf89c20-f9f5-4601-9754-a15b27b535e1/tnzc_a_891527_f0007_b.jpg)
![Figure 8 Soil water content at four positions around the olive trees subjected to three irrigation treatments (rainfed, deficit and irrigated) during the two hydrological years (2010–11 and 2011–12). Standard error bars are also indicated. For clarity, one-sided error bars of only two access tubes are shown.](/cms/asset/cb479516-394d-4d91-88d7-429a0d08b6d9/tnzc_a_891527_f0008_b.jpg)